29
/
en
AIzaSyAYiBZKx7MnpbEhh9jyipgxe19OcubqV5w
April 1, 2024
254229
Suriname
SUR
true
2
1
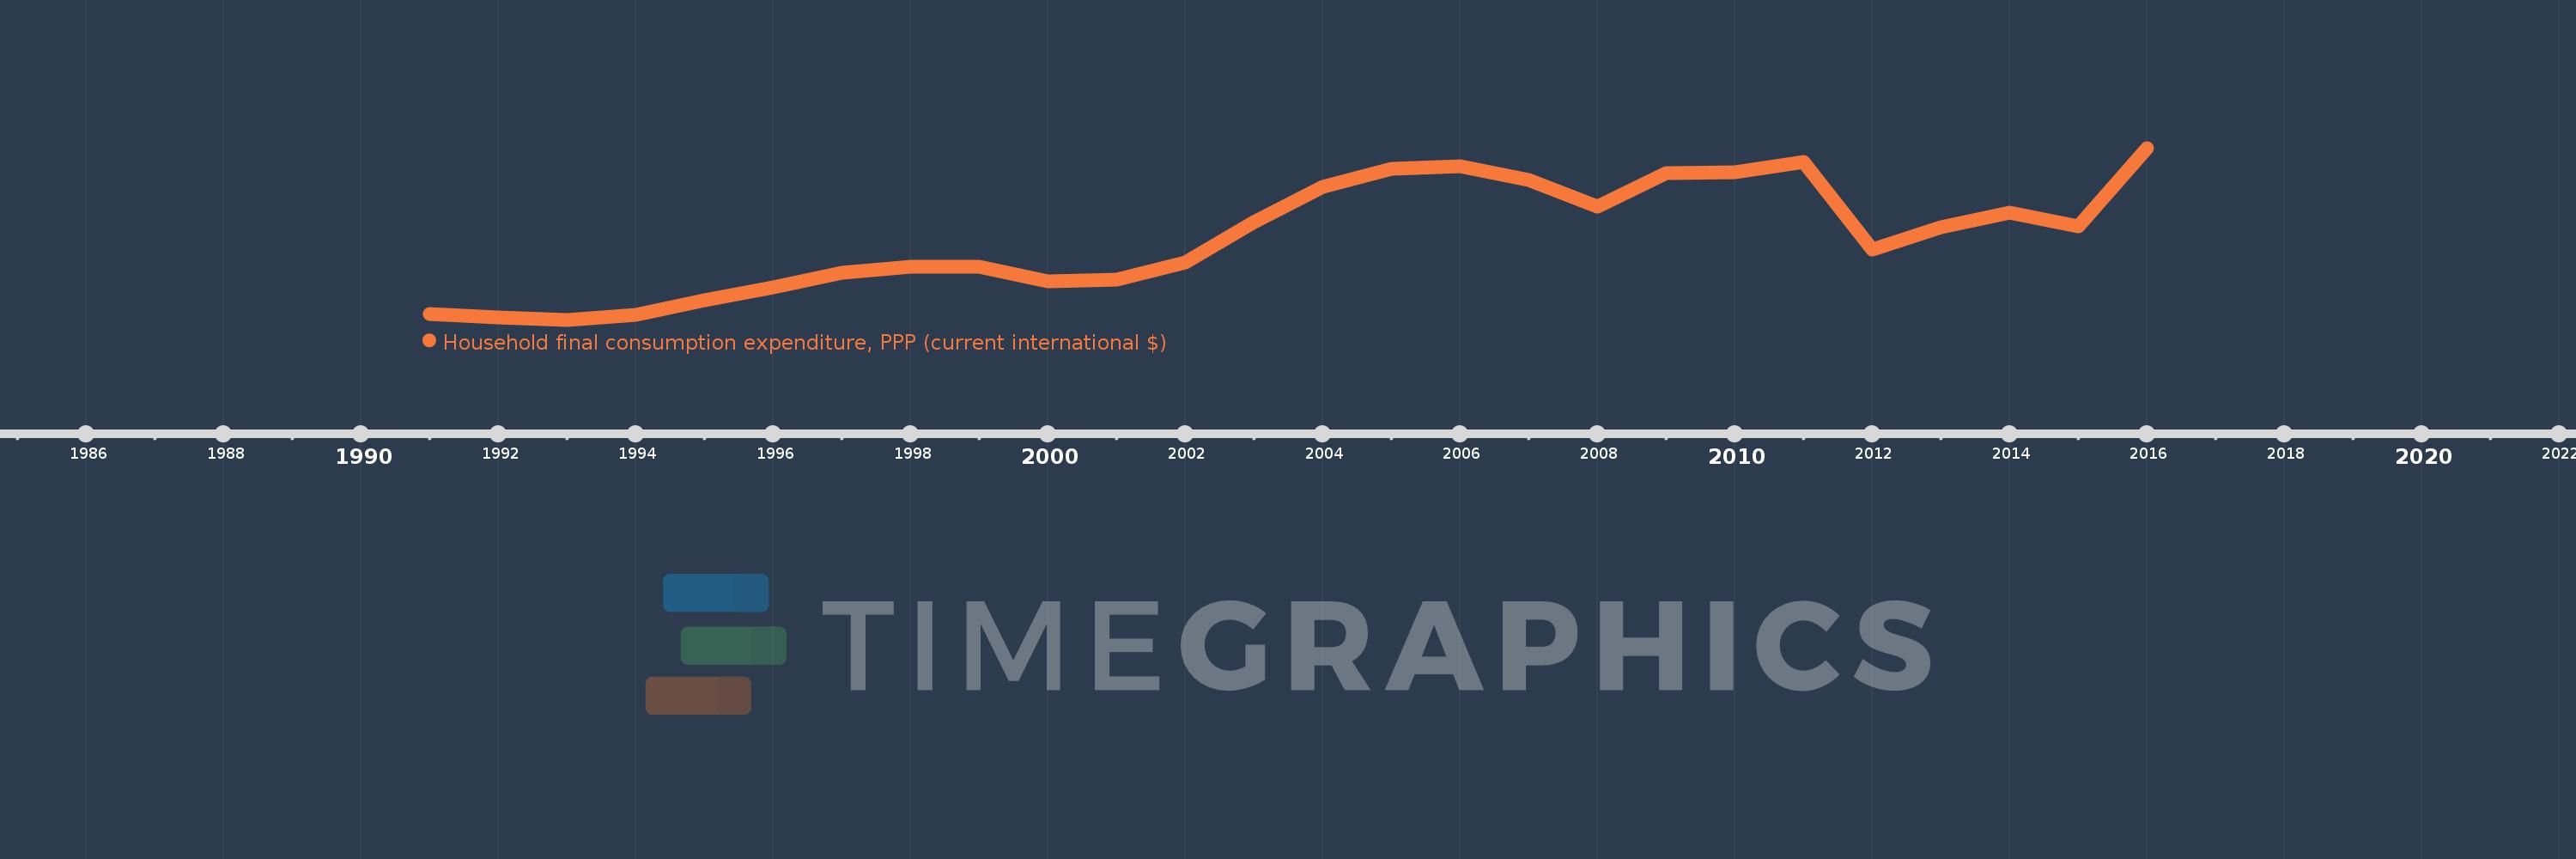
Household final consumption expenditure, PPP (current international $)
2016,2015,2014,2013,2012,2011,2010,2009,2008,2007,2006,2005,2004,2003,2002,2001,2000,1999,1998,1997,1996,1995,1994,1993,1992,1991
This statistics in other country:
AfghanistanAlbaniaAlgeriaAngolaAntigua and BarbudaArab WorldArgentinaArmeniaArubaAustraliaAustriaAzerbaijanBahamas, TheBahrainBangladeshBarbadosBelarusBelgiumBelizeBeninBermudaBhutanBoliviaBosnia and HerzegovinaBotswanaBrazilBrunei DarussalamBulgariaBurkina FasoBurundiCabo VerdeCambodiaCameroonCanadaCaribbean small statesCentral African RepublicCentral Europe and the BalticsChadChileChinaColombiaComorosCongo, Dem. Rep.Congo, Rep.Costa RicaCote d'IvoireCroatiaCubaCyprusCzech RepublicDenmarkDjiboutiDominicaDominican RepublicEarly-demographic dividendEast Asia & PacificEast Asia & Pacific (excluding high income)East Asia & Pacific (IDA & IBRD countries)EcuadorEgypt, Arab Rep.El SalvadorEquatorial GuineaEritreaEstoniaEthiopiaEuro areaEurope & Central AsiaEurope & Central Asia (excluding high income)Europe & Central Asia (IDA & IBRD countries)European UnionFijiFinlandFranceGabonGambia, TheGeorgiaGermanyGhanaGreeceGrenadaGuatemalaGuineaGuinea-BissauGuyanaHaitiHeavily indebted poor countries (HIPC)High incomeHondurasHong Kong SAR, ChinaHungaryIBRD onlyIcelandIDA & IBRD totalIDA blendIDA onlyIDA totalIndiaIndonesiaIran, Islamic Rep.IrelandIsraelItalyJamaicaJapanJordanKazakhstanKenyaKorea, Rep.KosovoKuwaitKyrgyz RepublicLao PDRLate-demographic dividendLatin America & Caribbean Latin America & Caribbean (excluding high income)Latin America & the Caribbean (IDA & IBRD countries)LatviaLeast developed countries: UN classificationLebanonLiberiaLibyaLithuaniaLow & middle incomeLow incomeLower middle incomeLuxembourgMacao SAR, ChinaMacedonia, FYRMadagascarMalawiMalaysiaMaliMaltaMauritaniaMauritiusMexicoMiddle East & North AfricaMiddle East & North Africa (excluding high income)Middle East & North Africa (IDA & IBRD countries)Middle incomeMoldovaMongoliaMontenegroMoroccoMozambiqueNamibiaNepalNetherlandsNew ZealandNicaraguaNigerNigeriaNorth AmericaNorwayOECD membersOmanOther small statesPakistanPanamaPapua New GuineaParaguayPeruPhilippinesPolandPortugalPost-demographic dividendPre-demographic dividendPuerto RicoQatarRomaniaRussian FederationRwandaSaudi ArabiaSenegalSerbiaSeychellesSierra LeoneSingaporeSlovak RepublicSloveniaSmall statesSolomon IslandsSouth AfricaSouth AsiaSouth Asia (IDA & IBRD)South SudanSpainSri LankaSt. Kitts and NevisSt. LuciaSt. Vincent and the GrenadinesSub-Saharan Africa Sub-Saharan Africa (excluding high income)Sub-Saharan Africa (IDA & IBRD countries)SudanSurinameSwazilandSwedenSwitzerlandSyrian Arab RepublicTajikistanTanzaniaThailandTimor-LesteTogoTongaTrinidad and TobagoTunisiaTurkeyTurkmenistanUgandaUkraineUnited Arab EmiratesUnited KingdomUnited StatesUpper middle incomeUruguayUzbekistanVanuatuVenezuela, RBVietnamWest Bank and GazaWorldYemen, Rep.ZambiaZimbabwe Timeline:
This timeline shows a graph from 1991 to 2016 of Suriname. No data until 1990. Number of actual observations by date: 26.
Source name:
World Development Indicators
Source organization:
World Bank, International Comparison Program database.
Categories, topics:
Economy & Growth
Last updated:
apr 23, 2017
Indicators value changes by year
Minimum:
761.199 mln
jan 1, 1993
Maximum:
2.775 bln
jan 1, 2016
At the date of observation
Value
Absolute change
Change from previous value
jan 1, 1991
832.397 mln
+832.397 mln
0.0%
jan 1, 1992
790.665 mln
-41.732 mln
-5.01%
jan 1, 1993
761.199 mln
-29.466 mln
-3.73%
jan 1, 1994
815.44 mln
+54.242 mln
7.13%
jan 1, 1995
994.596 mln
+179.156 mln
21.97%
jan 1, 1996
1.146 bln
+151.137 mln
15.2%
jan 1, 1997
1.315 bln
+169.194 mln
14.77%
jan 1, 1998
1.381 bln
+65.923 mln
5.01%
jan 1, 1999
1.385 bln
+4.041 mln
0.29%
jan 1, 2000
1.212 bln
-173.044 mln
-12.5%
jan 1, 2001
1.235 bln
+23.203 mln
1.91%
jan 1, 2002
1.428 bln
+192.932 mln
15.62%
jan 1, 2003
1.909 bln
+481.373 mln
33.71%
jan 1, 2004
2.319 bln
+409.78 mln
21.46%
jan 1, 2005
2.527 bln
+208.316 mln
8.98%
jan 1, 2006
2.563 bln
+35.802 mln
1.42%
jan 1, 2007
2.398 bln
-165.402 mln
-6.45%
jan 1, 2008
2.092 bln
-306.014 mln
-12.76%
jan 1, 2009
2.485 bln
+392.842 mln
18.78%
jan 1, 2010
2.489 bln
+4.126 mln
0.17%
jan 1, 2011
2.608 bln
+119.32 mln
4.79%
jan 1, 2012
1.584 bln
-1.024 bln
-39.28%
jan 1, 2013
1.842 bln
+257.904 mln
16.28%
jan 1, 2014
2.013 bln
+171.011 mln
9.29%
jan 1, 2015
1.859 bln
-153.504 mln
-7.63%
jan 1, 2016
2.775 bln
+915.873 mln
49.26%
Ranking of countries by current statistics by years


Comments: