29
/
en
AIzaSyAYiBZKx7MnpbEhh9jyipgxe19OcubqV5w
April 1, 2024
208045
Netherlands
NLD
true
2
1
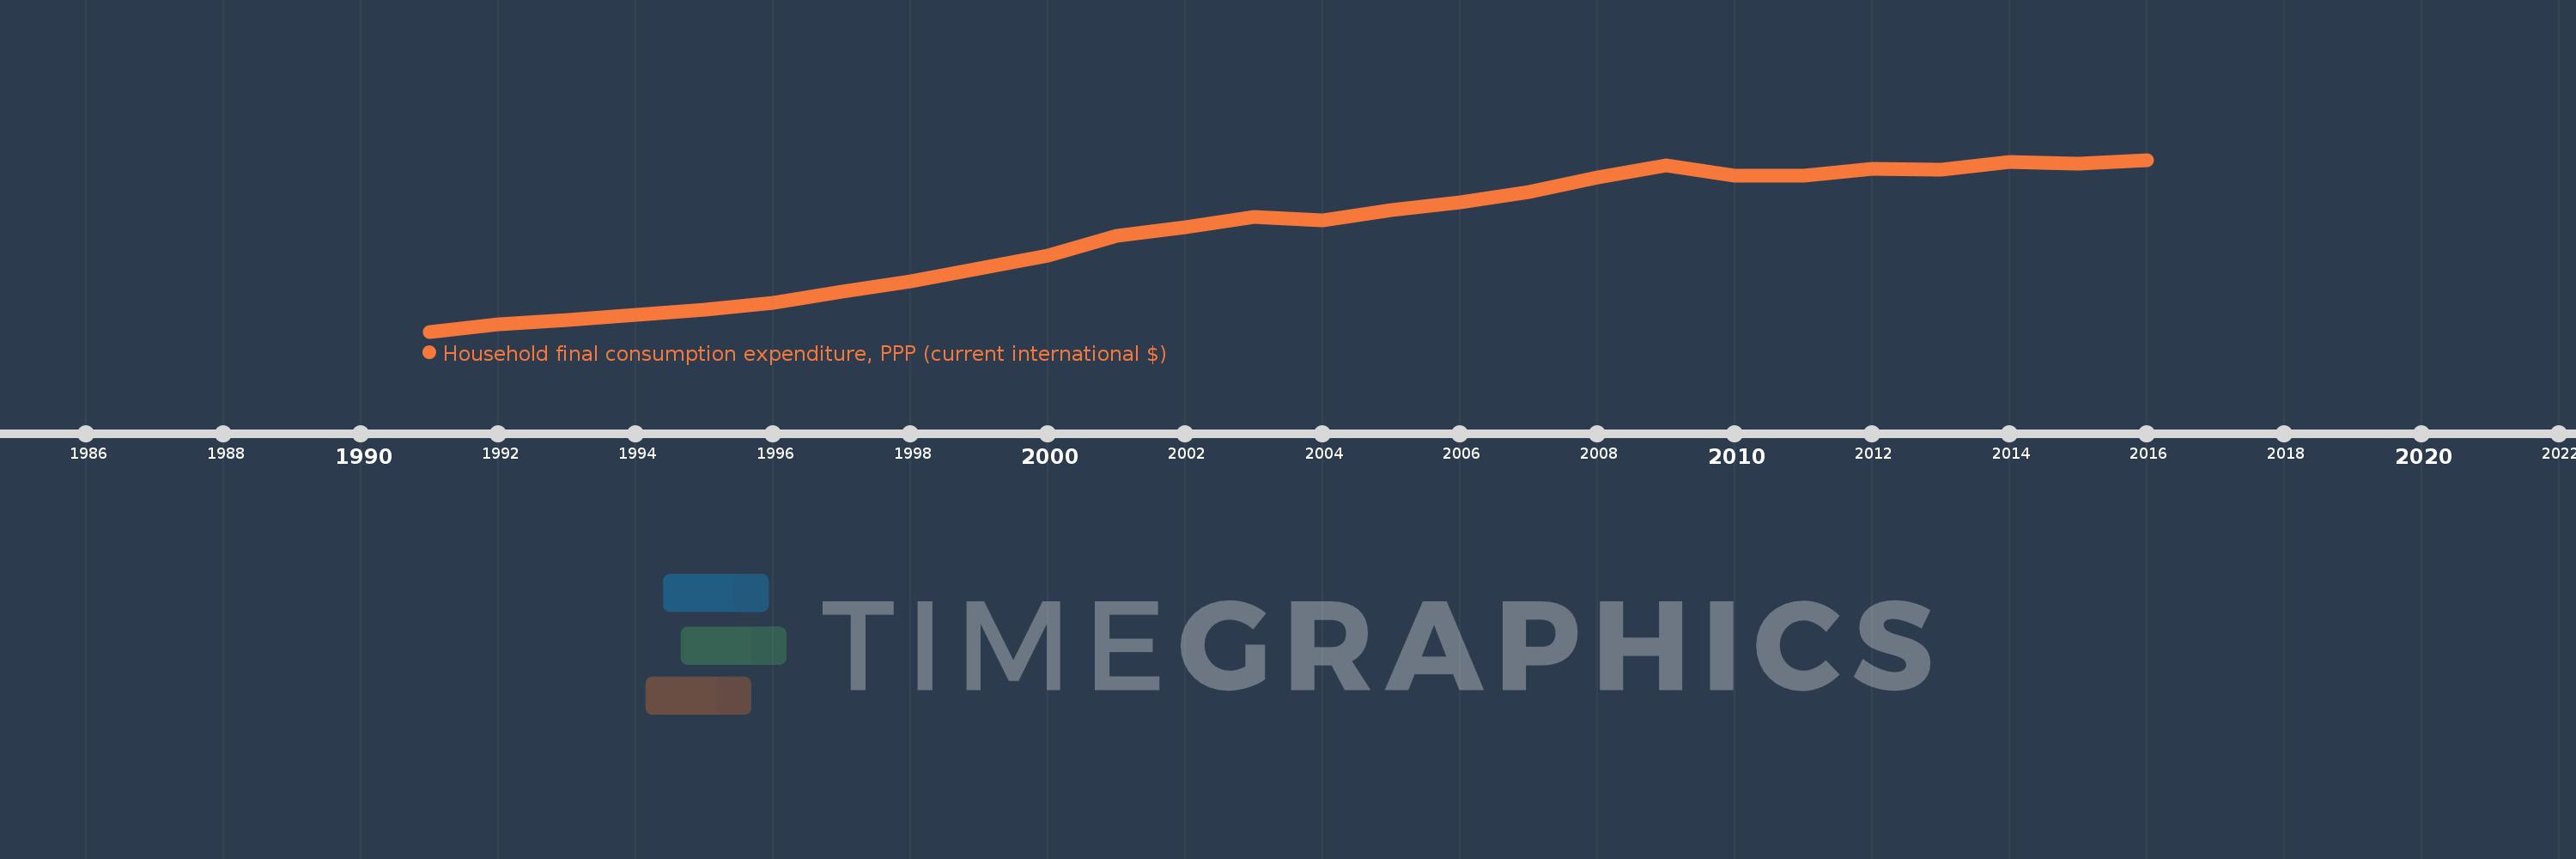
Household final consumption expenditure, PPP (current international $)
2016,2015,2014,2013,2012,2011,2010,2009,2008,2007,2006,2005,2004,2003,2002,2001,2000,1999,1998,1997,1996,1995,1994,1993,1992,1991
This statistics in other country:
AfghanistanAlbaniaAlgeriaAngolaAntigua and BarbudaArab WorldArgentinaArmeniaArubaAustraliaAustriaAzerbaijanBahamas, TheBahrainBangladeshBarbadosBelarusBelgiumBelizeBeninBermudaBhutanBoliviaBosnia and HerzegovinaBotswanaBrazilBrunei DarussalamBulgariaBurkina FasoBurundiCabo VerdeCambodiaCameroonCanadaCaribbean small statesCentral African RepublicCentral Europe and the BalticsChadChileChinaColombiaComorosCongo, Dem. Rep.Congo, Rep.Costa RicaCote d'IvoireCroatiaCubaCyprusCzech RepublicDenmarkDjiboutiDominicaDominican RepublicEarly-demographic dividendEast Asia & PacificEast Asia & Pacific (excluding high income)East Asia & Pacific (IDA & IBRD countries)EcuadorEgypt, Arab Rep.El SalvadorEquatorial GuineaEritreaEstoniaEthiopiaEuro areaEurope & Central AsiaEurope & Central Asia (excluding high income)Europe & Central Asia (IDA & IBRD countries)European UnionFijiFinlandFranceGabonGambia, TheGeorgiaGermanyGhanaGreeceGrenadaGuatemalaGuineaGuinea-BissauGuyanaHaitiHeavily indebted poor countries (HIPC)High incomeHondurasHong Kong SAR, ChinaHungaryIBRD onlyIcelandIDA & IBRD totalIDA blendIDA onlyIDA totalIndiaIndonesiaIran, Islamic Rep.IrelandIsraelItalyJamaicaJapanJordanKazakhstanKenyaKorea, Rep.KosovoKuwaitKyrgyz RepublicLao PDRLate-demographic dividendLatin America & Caribbean Latin America & Caribbean (excluding high income)Latin America & the Caribbean (IDA & IBRD countries)LatviaLeast developed countries: UN classificationLebanonLiberiaLibyaLithuaniaLow & middle incomeLow incomeLower middle incomeLuxembourgMacao SAR, ChinaMacedonia, FYRMadagascarMalawiMalaysiaMaliMaltaMauritaniaMauritiusMexicoMiddle East & North AfricaMiddle East & North Africa (excluding high income)Middle East & North Africa (IDA & IBRD countries)Middle incomeMoldovaMongoliaMontenegroMoroccoMozambiqueNamibiaNepalNetherlandsNew ZealandNicaraguaNigerNigeriaNorth AmericaNorwayOECD membersOmanOther small statesPakistanPanamaPapua New GuineaParaguayPeruPhilippinesPolandPortugalPost-demographic dividendPre-demographic dividendPuerto RicoQatarRomaniaRussian FederationRwandaSaudi ArabiaSenegalSerbiaSeychellesSierra LeoneSingaporeSlovak RepublicSloveniaSmall statesSolomon IslandsSouth AfricaSouth AsiaSouth Asia (IDA & IBRD)South SudanSpainSri LankaSt. Kitts and NevisSt. LuciaSt. Vincent and the GrenadinesSub-Saharan Africa Sub-Saharan Africa (excluding high income)Sub-Saharan Africa (IDA & IBRD countries)SudanSurinameSwazilandSwedenSwitzerlandSyrian Arab RepublicTajikistanTanzaniaThailandTimor-LesteTogoTongaTrinidad and TobagoTunisiaTurkeyTurkmenistanUgandaUkraineUnited Arab EmiratesUnited KingdomUnited StatesUpper middle incomeUruguayUzbekistanVanuatuVenezuela, RBVietnamWest Bank and GazaWorldYemen, Rep.ZambiaZimbabwe Timeline:
This timeline shows a graph from 1991 to 2016 of Netherlands. No data until 1990. Number of actual observations by date: 26.
Source name:
World Development Indicators
Source organization:
World Bank, International Comparison Program database.
Categories, topics:
Economy & Growth
Last updated:
apr 23, 2017
Indicators value changes by year
Minimum:
141.305 bln
jan 1, 1991
Maximum:
339.17 bln
jan 1, 2016
At the date of observation
Value
Absolute change
Change from previous value
jan 1, 1991
141.305 bln
+141.305 bln
0.0%
jan 1, 1992
149.892 bln
+8.587 bln
6.08%
jan 1, 1993
154.956 bln
+5.064 bln
3.38%
jan 1, 1994
160.113 bln
+5.157 bln
3.33%
jan 1, 1995
166.632 bln
+6.52 bln
4.07%
jan 1, 1996
174.623 bln
+7.991 bln
4.8%
jan 1, 1997
187.624 bln
+13.001 bln
7.44%
jan 1, 1998
198.757 bln
+11.133 bln
5.93%
jan 1, 1999
213.955 bln
+15.198 bln
7.65%
jan 1, 2000
229.316 bln
+15.361 bln
7.18%
jan 1, 2001
251.504 bln
+22.188 bln
9.68%
jan 1, 2002
261.443 bln
+9.939 bln
3.95%
jan 1, 2003
273.776 bln
+12.332 bln
4.72%
jan 1, 2004
269.293 bln
-4.482 bln
-1.64%
jan 1, 2005
281.454 bln
+12.16 bln
4.52%
jan 1, 2006
290.285 bln
+8.831 bln
3.14%
jan 1, 2007
301.583 bln
+11.298 bln
3.89%
jan 1, 2008
319.07 bln
+17.487 bln
5.8%
jan 1, 2009
332.333 bln
+13.263 bln
4.16%
jan 1, 2010
320.813 bln
-11.52 bln
-3.47%
jan 1, 2011
320.583 bln
-230.384 mln
-0.07%
jan 1, 2012
328.812 bln
+8.23 bln
2.57%
jan 1, 2013
328.258 bln
-554.77 mln
-0.17%
jan 1, 2014
336.699 bln
+8.441 bln
2.57%
jan 1, 2015
334.794 bln
-1.904 bln
-0.57%
jan 1, 2016
339.17 bln
+4.376 bln
1.31%
Ranking of countries by current statistics by years


Comments: