29
/
en
AIzaSyAYiBZKx7MnpbEhh9jyipgxe19OcubqV5w
April 1, 2024
119016
Denmark
DNK
true
2
1
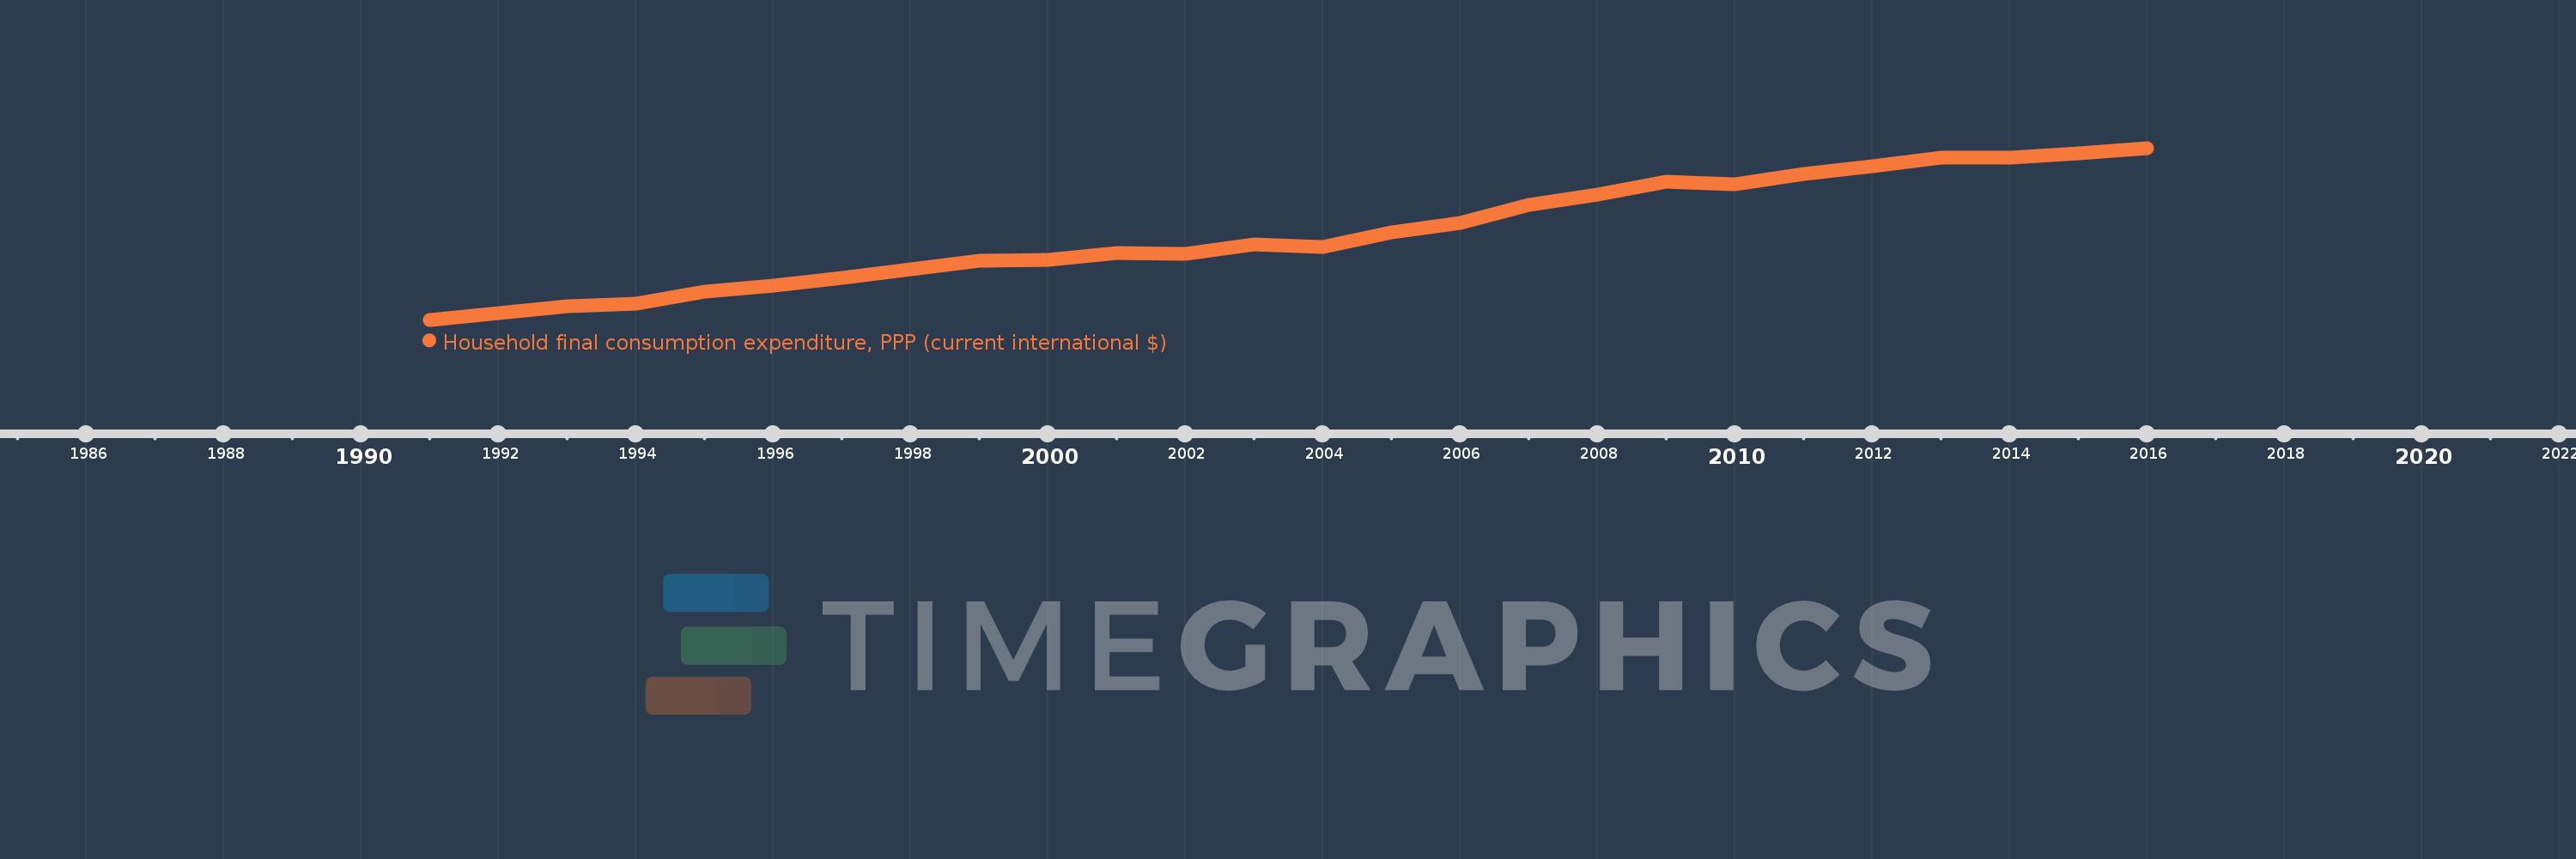
Household final consumption expenditure, PPP (current international $)
2016,2015,2014,2013,2012,2011,2010,2009,2008,2007,2006,2005,2004,2003,2002,2001,2000,1999,1998,1997,1996,1995,1994,1993,1992,1991
This statistics in other country:
AfghanistanAlbaniaAlgeriaAngolaAntigua and BarbudaArab WorldArgentinaArmeniaArubaAustraliaAustriaAzerbaijanBahamas, TheBahrainBangladeshBarbadosBelarusBelgiumBelizeBeninBermudaBhutanBoliviaBosnia and HerzegovinaBotswanaBrazilBrunei DarussalamBulgariaBurkina FasoBurundiCabo VerdeCambodiaCameroonCanadaCaribbean small statesCentral African RepublicCentral Europe and the BalticsChadChileChinaColombiaComorosCongo, Dem. Rep.Congo, Rep.Costa RicaCote d'IvoireCroatiaCubaCyprusCzech RepublicDenmarkDjiboutiDominicaDominican RepublicEarly-demographic dividendEast Asia & PacificEast Asia & Pacific (excluding high income)East Asia & Pacific (IDA & IBRD countries)EcuadorEgypt, Arab Rep.El SalvadorEquatorial GuineaEritreaEstoniaEthiopiaEuro areaEurope & Central AsiaEurope & Central Asia (excluding high income)Europe & Central Asia (IDA & IBRD countries)European UnionFijiFinlandFranceGabonGambia, TheGeorgiaGermanyGhanaGreeceGrenadaGuatemalaGuineaGuinea-BissauGuyanaHaitiHeavily indebted poor countries (HIPC)High incomeHondurasHong Kong SAR, ChinaHungaryIBRD onlyIcelandIDA & IBRD totalIDA blendIDA onlyIDA totalIndiaIndonesiaIran, Islamic Rep.IrelandIsraelItalyJamaicaJapanJordanKazakhstanKenyaKorea, Rep.KosovoKuwaitKyrgyz RepublicLao PDRLate-demographic dividendLatin America & Caribbean Latin America & Caribbean (excluding high income)Latin America & the Caribbean (IDA & IBRD countries)LatviaLeast developed countries: UN classificationLebanonLiberiaLibyaLithuaniaLow & middle incomeLow incomeLower middle incomeLuxembourgMacao SAR, ChinaMacedonia, FYRMadagascarMalawiMalaysiaMaliMaltaMauritaniaMauritiusMexicoMiddle East & North AfricaMiddle East & North Africa (excluding high income)Middle East & North Africa (IDA & IBRD countries)Middle incomeMoldovaMongoliaMontenegroMoroccoMozambiqueNamibiaNepalNetherlandsNew ZealandNicaraguaNigerNigeriaNorth AmericaNorwayOECD membersOmanOther small statesPakistanPanamaPapua New GuineaParaguayPeruPhilippinesPolandPortugalPost-demographic dividendPre-demographic dividendPuerto RicoQatarRomaniaRussian FederationRwandaSaudi ArabiaSenegalSerbiaSeychellesSierra LeoneSingaporeSlovak RepublicSloveniaSmall statesSolomon IslandsSouth AfricaSouth AsiaSouth Asia (IDA & IBRD)South SudanSpainSri LankaSt. Kitts and NevisSt. LuciaSt. Vincent and the GrenadinesSub-Saharan Africa Sub-Saharan Africa (excluding high income)Sub-Saharan Africa (IDA & IBRD countries)SudanSurinameSwazilandSwedenSwitzerlandSyrian Arab RepublicTajikistanTanzaniaThailandTimor-LesteTogoTongaTrinidad and TobagoTunisiaTurkeyTurkmenistanUgandaUkraineUnited Arab EmiratesUnited KingdomUnited StatesUpper middle incomeUruguayUzbekistanVanuatuVenezuela, RBVietnamWest Bank and GazaWorldYemen, Rep.ZambiaZimbabwe Timeline:
This timeline shows a graph from 1991 to 2016 of Denmark. No data until 1990. Number of actual observations by date: 26.
Source name:
World Development Indicators
Source organization:
World Bank, International Comparison Program database.
Categories, topics:
Economy & Growth
Last updated:
apr 23, 2017
Indicators value changes by year
Minimum:
47.127 bln
jan 1, 1991
Maximum:
111.343 bln
jan 1, 2016
At the date of observation
Value
Absolute change
Change from previous value
jan 1, 1991
47.127 bln
+47.127 bln
0.0%
jan 1, 1992
49.499 bln
+2.372 bln
5.03%
jan 1, 1993
52.148 bln
+2.65 bln
5.35%
jan 1, 1994
53.163 bln
+1.015 bln
1.95%
jan 1, 1995
57.712 bln
+4.549 bln
8.56%
jan 1, 1996
59.871 bln
+2.159 bln
3.74%
jan 1, 1997
62.622 bln
+2.751 bln
4.59%
jan 1, 1998
66.12 bln
+3.498 bln
5.59%
jan 1, 1999
69.257 bln
+3.137 bln
4.74%
jan 1, 2000
69.665 bln
+407.494 mln
0.59%
jan 1, 2001
71.943 bln
+2.278 bln
3.27%
jan 1, 2002
71.824 bln
-118.787 mln
-0.17%
jan 1, 2003
75.337 bln
+3.513 bln
4.89%
jan 1, 2004
74.42 bln
-917.213 mln
-1.22%
jan 1, 2005
79.874 bln
+5.454 bln
7.33%
jan 1, 2006
83.437 bln
+3.563 bln
4.46%
jan 1, 2007
90.007 bln
+6.57 bln
7.87%
jan 1, 2008
93.887 bln
+3.88 bln
4.31%
jan 1, 2009
98.644 bln
+4.757 bln
5.07%
jan 1, 2010
97.743 bln
-901.186 mln
-0.91%
jan 1, 2011
101.478 bln
+3.735 bln
3.82%
jan 1, 2012
104.412 bln
+2.933 bln
2.89%
jan 1, 2013
107.667 bln
+3.255 bln
3.12%
jan 1, 2014
107.743 bln
+76.242 mln
0.07%
jan 1, 2015
109.168 bln
+1.425 bln
1.32%
jan 1, 2016
111.343 bln
+2.175 bln
1.99%
Ranking of countries by current statistics by years


Comments: