29
/
en
AIzaSyAYiBZKx7MnpbEhh9jyipgxe19OcubqV5w
April 1, 2024
268092
Tunisia
TUN
true
2
1
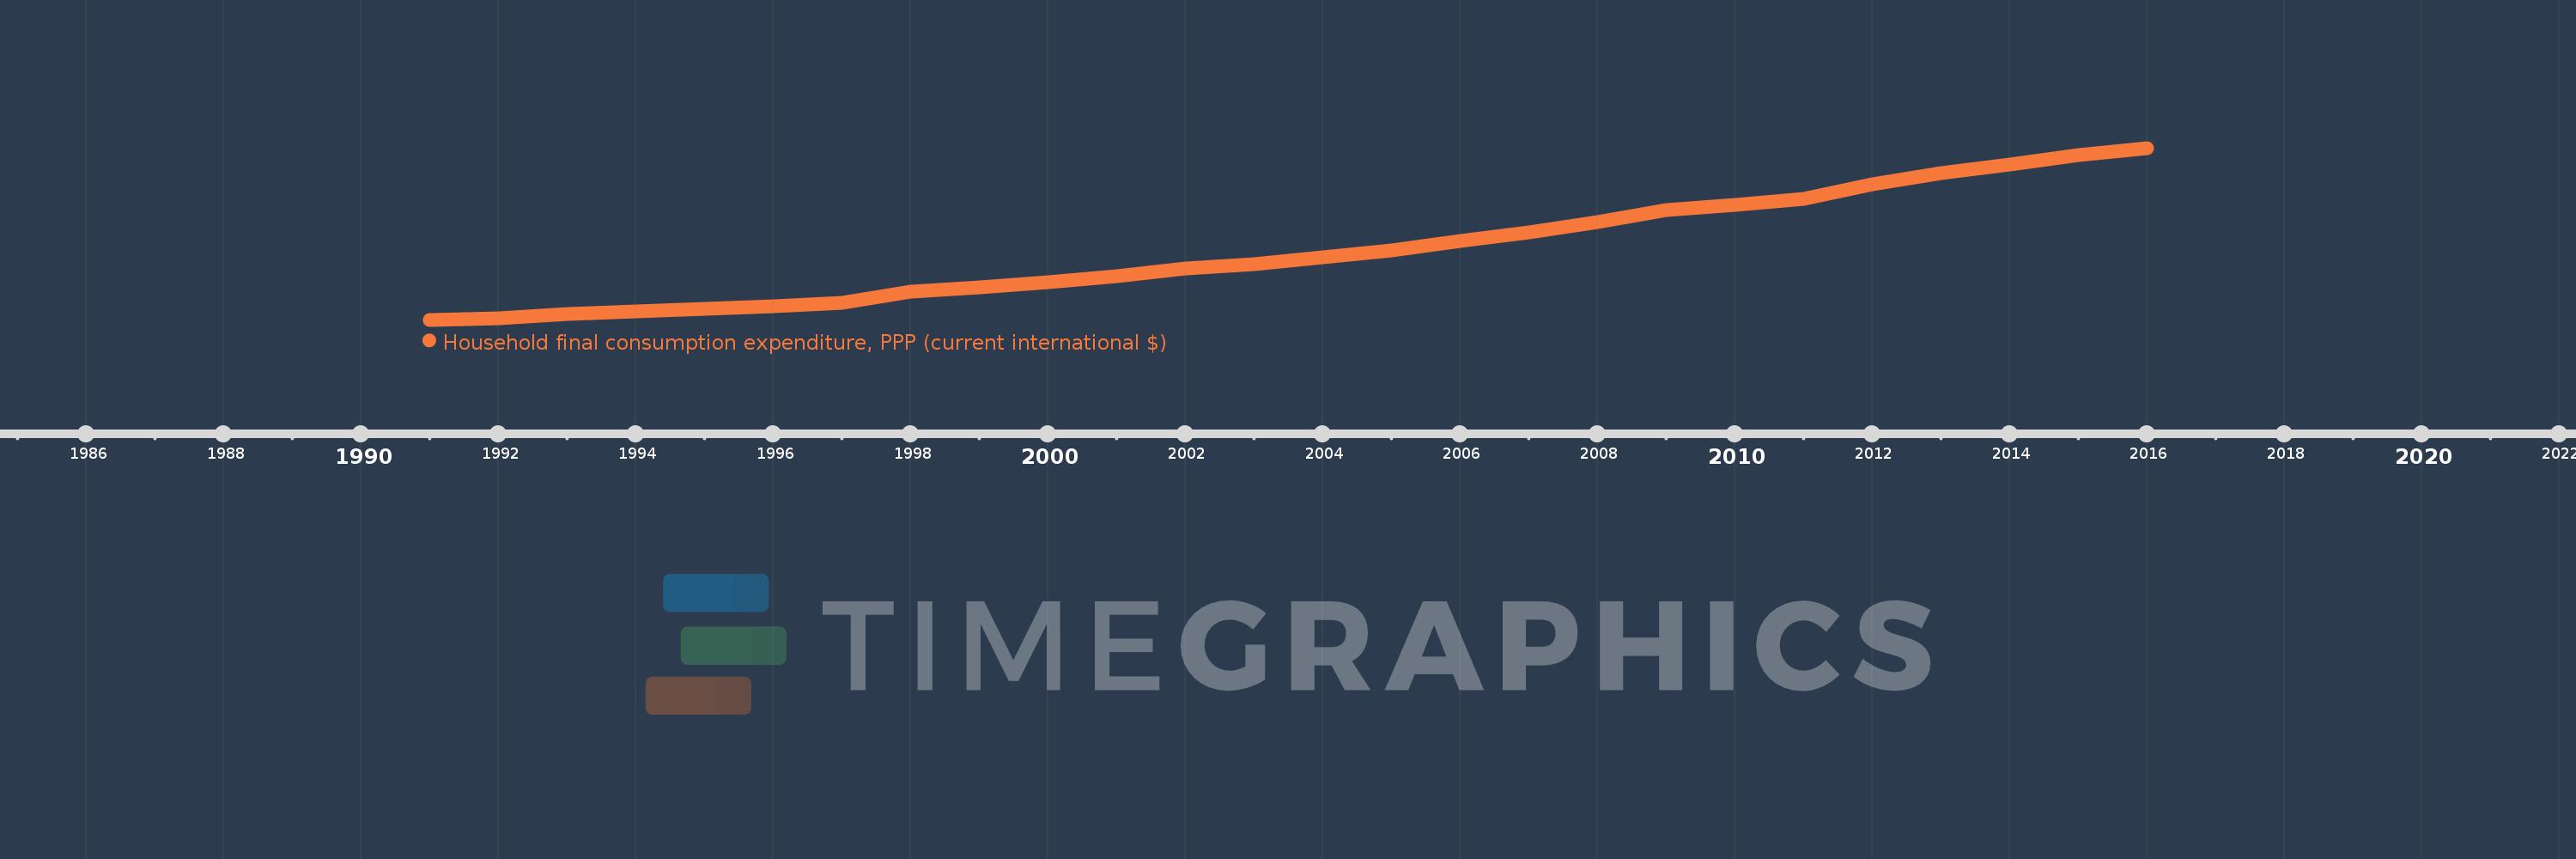
Household final consumption expenditure, PPP (current international $)
2016,2015,2014,2013,2012,2011,2010,2009,2008,2007,2006,2005,2004,2003,2002,2001,2000,1999,1998,1997,1996,1995,1994,1993,1992,1991
This statistics in other country:
AfghanistanAlbaniaAlgeriaAngolaAntigua and BarbudaArab WorldArgentinaArmeniaArubaAustraliaAustriaAzerbaijanBahamas, TheBahrainBangladeshBarbadosBelarusBelgiumBelizeBeninBermudaBhutanBoliviaBosnia and HerzegovinaBotswanaBrazilBrunei DarussalamBulgariaBurkina FasoBurundiCabo VerdeCambodiaCameroonCanadaCaribbean small statesCentral African RepublicCentral Europe and the BalticsChadChileChinaColombiaComorosCongo, Dem. Rep.Congo, Rep.Costa RicaCote d'IvoireCroatiaCubaCyprusCzech RepublicDenmarkDjiboutiDominicaDominican RepublicEarly-demographic dividendEast Asia & PacificEast Asia & Pacific (excluding high income)East Asia & Pacific (IDA & IBRD countries)EcuadorEgypt, Arab Rep.El SalvadorEquatorial GuineaEritreaEstoniaEthiopiaEuro areaEurope & Central AsiaEurope & Central Asia (excluding high income)Europe & Central Asia (IDA & IBRD countries)European UnionFijiFinlandFranceGabonGambia, TheGeorgiaGermanyGhanaGreeceGrenadaGuatemalaGuineaGuinea-BissauGuyanaHaitiHeavily indebted poor countries (HIPC)High incomeHondurasHong Kong SAR, ChinaHungaryIBRD onlyIcelandIDA & IBRD totalIDA blendIDA onlyIDA totalIndiaIndonesiaIran, Islamic Rep.IrelandIsraelItalyJamaicaJapanJordanKazakhstanKenyaKorea, Rep.KosovoKuwaitKyrgyz RepublicLao PDRLate-demographic dividendLatin America & Caribbean Latin America & Caribbean (excluding high income)Latin America & the Caribbean (IDA & IBRD countries)LatviaLeast developed countries: UN classificationLebanonLiberiaLibyaLithuaniaLow & middle incomeLow incomeLower middle incomeLuxembourgMacao SAR, ChinaMacedonia, FYRMadagascarMalawiMalaysiaMaliMaltaMauritaniaMauritiusMexicoMiddle East & North AfricaMiddle East & North Africa (excluding high income)Middle East & North Africa (IDA & IBRD countries)Middle incomeMoldovaMongoliaMontenegroMoroccoMozambiqueNamibiaNepalNetherlandsNew ZealandNicaraguaNigerNigeriaNorth AmericaNorwayOECD membersOmanOther small statesPakistanPanamaPapua New GuineaParaguayPeruPhilippinesPolandPortugalPost-demographic dividendPre-demographic dividendPuerto RicoQatarRomaniaRussian FederationRwandaSaudi ArabiaSenegalSerbiaSeychellesSierra LeoneSingaporeSlovak RepublicSloveniaSmall statesSolomon IslandsSouth AfricaSouth AsiaSouth Asia (IDA & IBRD)South SudanSpainSri LankaSt. Kitts and NevisSt. LuciaSt. Vincent and the GrenadinesSub-Saharan Africa Sub-Saharan Africa (excluding high income)Sub-Saharan Africa (IDA & IBRD countries)SudanSurinameSwazilandSwedenSwitzerlandSyrian Arab RepublicTajikistanTanzaniaThailandTimor-LesteTogoTongaTrinidad and TobagoTunisiaTurkeyTurkmenistanUgandaUkraineUnited Arab EmiratesUnited KingdomUnited StatesUpper middle incomeUruguayUzbekistanVanuatuVenezuela, RBVietnamWest Bank and GazaWorldYemen, Rep.ZambiaZimbabwe Timeline:
This timeline shows a graph from 1991 to 2016 of Tunisia. No data until 1990. Number of actual observations by date: 26.
Source name:
World Development Indicators
Source organization:
World Bank, International Comparison Program database.
Categories, topics:
Economy & Growth
Last updated:
apr 23, 2017
Indicators value changes by year
Minimum:
12.864 bln
jan 1, 1991
Maximum:
74.229 bln
jan 1, 2016
At the date of observation
Value
Absolute change
Change from previous value
jan 1, 1991
12.864 bln
+12.864 bln
0.0%
jan 1, 1992
13.518 bln
+653.533 mln
5.08%
jan 1, 1993
14.837 bln
+1.319 bln
9.76%
jan 1, 1994
15.79 bln
+953.364 mln
6.43%
jan 1, 1995
16.669 bln
+878.537 mln
5.56%
jan 1, 1996
17.658 bln
+989.577 mln
5.94%
jan 1, 1997
18.977 bln
+1.319 bln
7.47%
jan 1, 1998
22.746 bln
+3.77 bln
19.86%
jan 1, 1999
24.285 bln
+1.538 bln
6.76%
jan 1, 2000
26.258 bln
+1.973 bln
8.12%
jan 1, 2001
28.304 bln
+2.047 bln
7.79%
jan 1, 2002
31.065 bln
+2.761 bln
9.75%
jan 1, 2003
32.655 bln
+1.59 bln
5.12%
jan 1, 2004
35.048 bln
+2.394 bln
7.33%
jan 1, 2005
37.767 bln
+2.719 bln
7.76%
jan 1, 2006
40.922 bln
+3.155 bln
8.35%
jan 1, 2007
44.133 bln
+3.211 bln
7.85%
jan 1, 2008
47.725 bln
+3.592 bln
8.14%
jan 1, 2009
51.906 bln
+4.181 bln
8.76%
jan 1, 2010
53.86 bln
+1.954 bln
3.77%
jan 1, 2011
56.097 bln
+2.237 bln
4.15%
jan 1, 2012
61.223 bln
+5.126 bln
9.14%
jan 1, 2013
65.233 bln
+4.01 bln
6.55%
jan 1, 2014
68.181 bln
+2.948 bln
4.52%
jan 1, 2015
71.646 bln
+3.465 bln
5.08%
jan 1, 2016
74.229 bln
+2.583 bln
3.6%
Ranking of countries by current statistics by years


Comments: