29
/
en
AIzaSyAYiBZKx7MnpbEhh9jyipgxe19OcubqV5w
April 1, 2024
44554
Least developed countries: UN classification
LDC
false
2
1
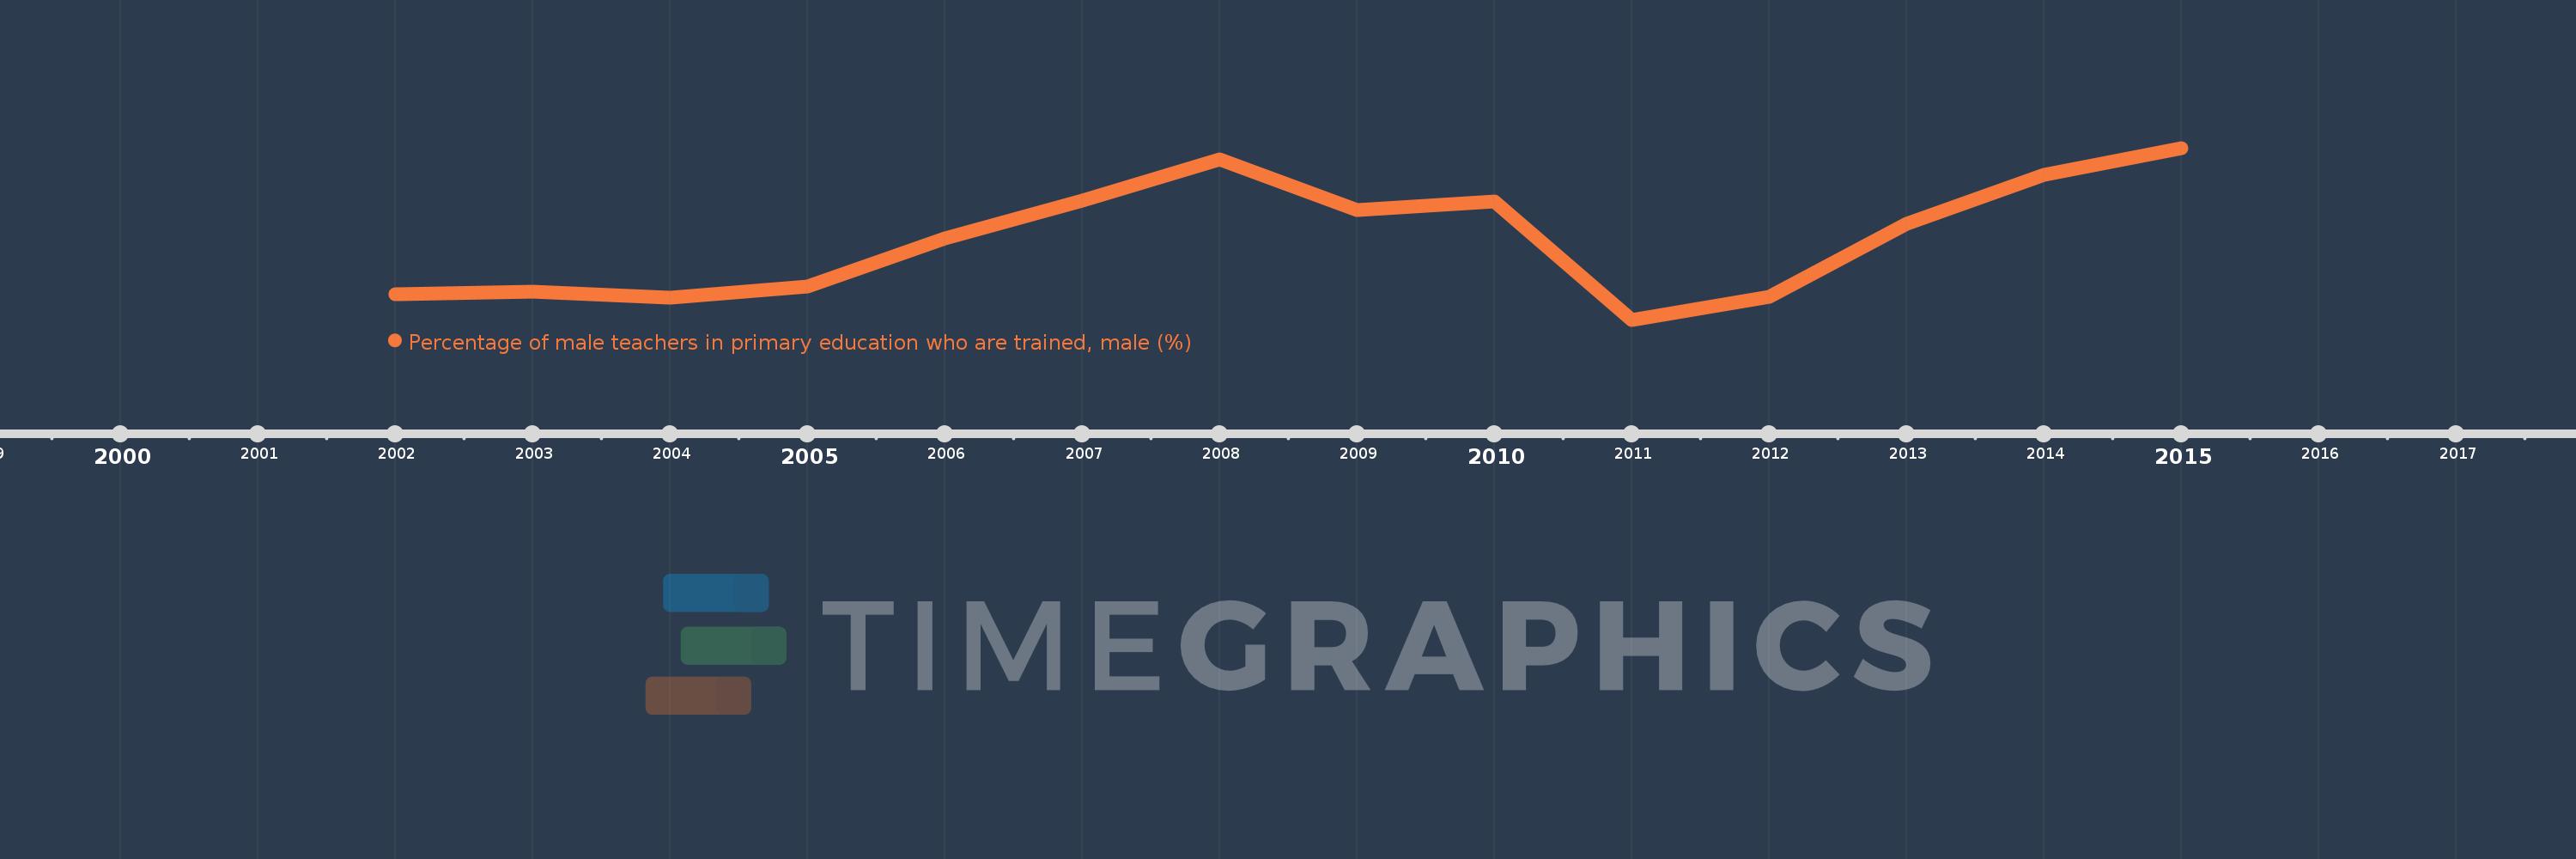
Percentage of male teachers in primary education who are trained, male (%)
2015,2014,2013,2012,2011,2010,2009,2008,2007,2006,2005,2004,2003,2002
This statistics in other country:
Timeline:
This timeline shows a graph from 2002 to 2015 of Least developed countries: UN classification. No data until 2001. Number of actual observations by date: 14.
Source name:
World Development Indicators
Source organization:
United Nations Educational, Scientific, and Cultural Organization (UNESCO) Institute for Statistics.
Categories, topics:
Education, Gender
Last updated:
apr 23, 2017
Indicators value changes by year
Minimum:
72.075
jan 1, 2011
Maximum:
76.937
jan 1, 2015
At the date of observation
Value
Absolute change
Change from previous value
jan 1, 2002
72.796
+72.796
0.0%
jan 1, 2003
72.871
+0.075
0.1%
jan 1, 2004
72.7
-0.171
-0.23%
jan 1, 2005
73.016
+0.316
0.43%
jan 1, 2006
74.382
+1.366
1.87%
jan 1, 2007
75.447
+1.065
1.43%
jan 1, 2008
76.62
+1.173
1.55%
jan 1, 2009
75.17
-1.45
-1.89%
jan 1, 2010
75.421
+0.251
0.33%
jan 1, 2011
72.075
-3.347
-4.44%
jan 1, 2012
72.724
+0.65
0.9%
jan 1, 2013
74.787
+2.063
2.84%
jan 1, 2014
76.165
+1.378
1.84%
jan 1, 2015
76.937
+0.771
1.01%
Ranking of countries by current statistics by years


Comments: