29
/
en
AIzaSyAYiBZKx7MnpbEhh9jyipgxe19OcubqV5w
April 1, 2024
148365
Guyana
GUY
true
2
1
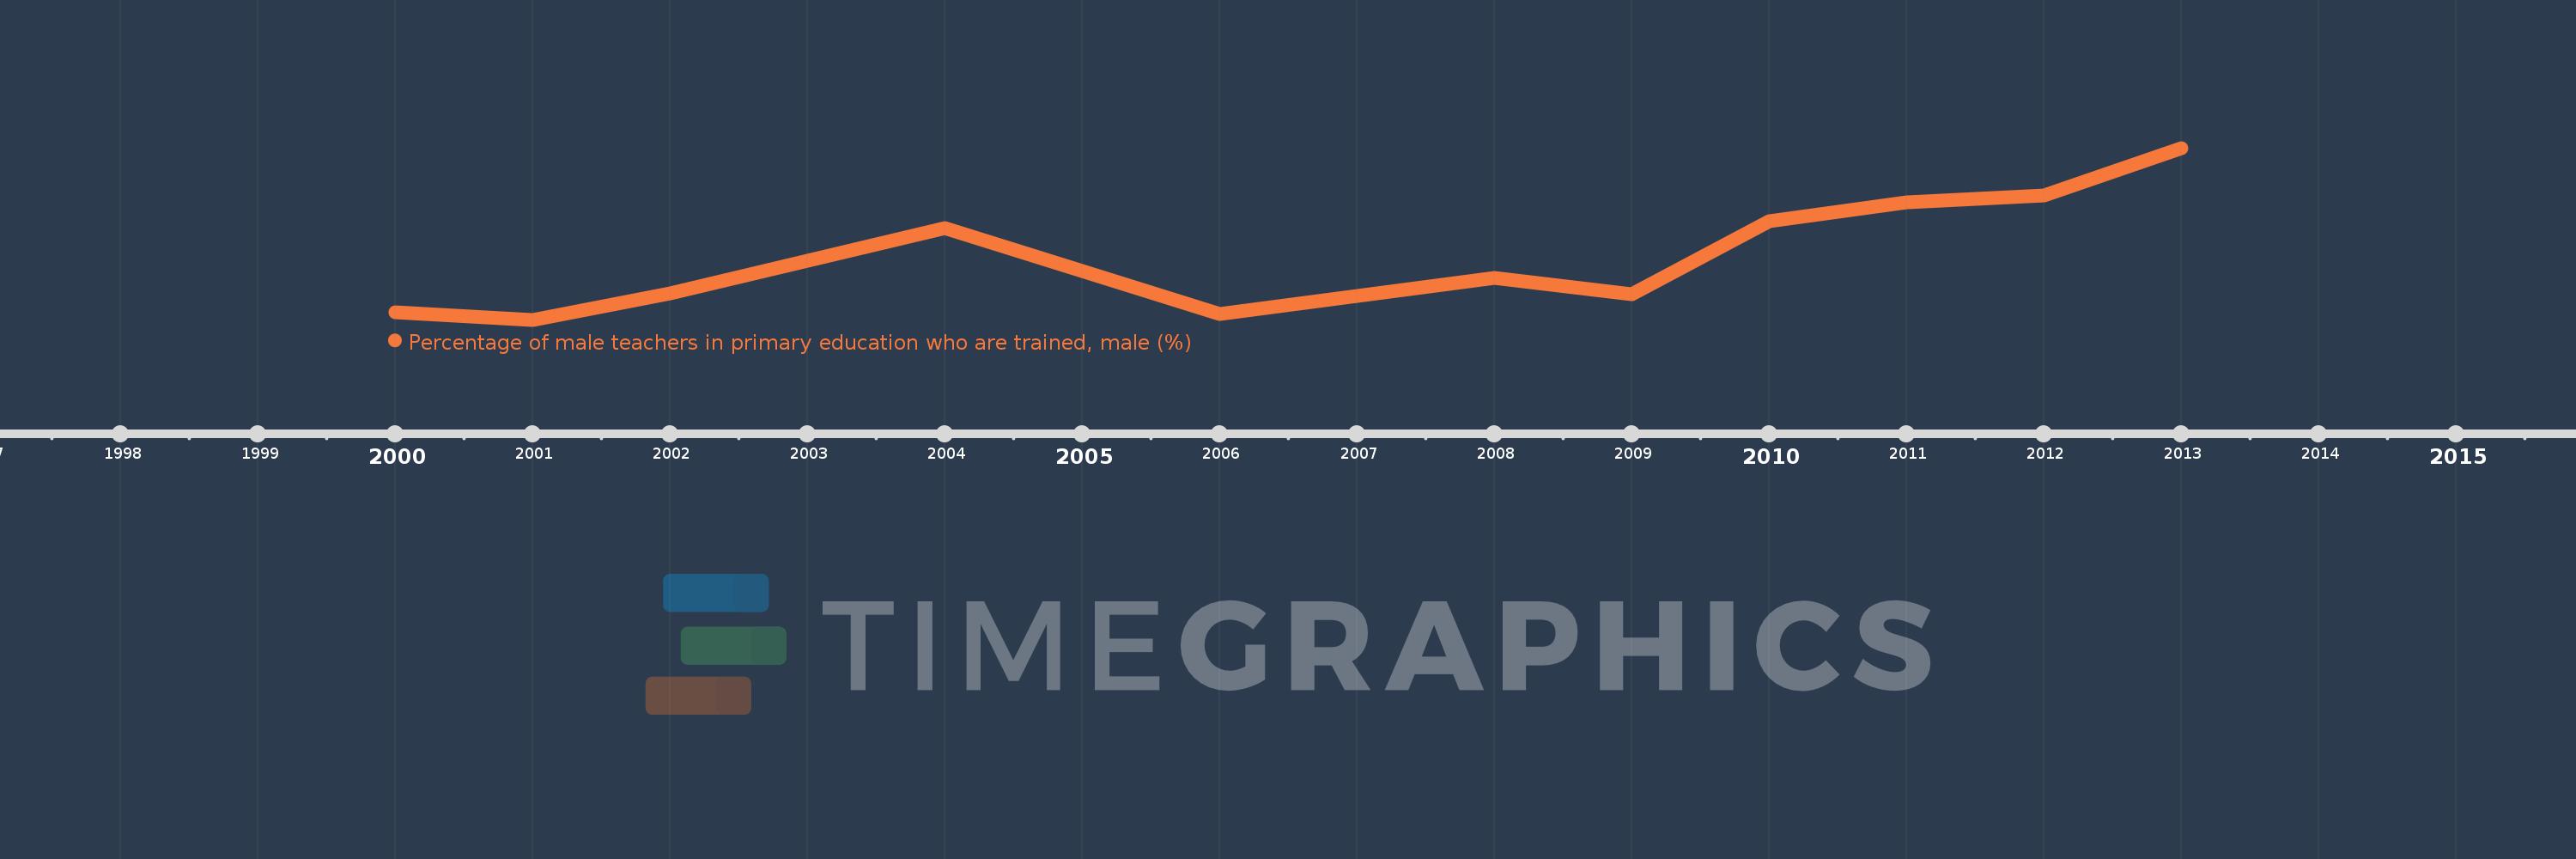
Percentage of male teachers in primary education who are trained, male (%)
2013,2012,2011,2010,2009,2008,2006,2004,2002,2001,2000
This statistics in other country:
Timeline:
This timeline shows a graph from 2000 to 2013 of Guyana. No data until 1999. Number of actual observations by date: 11.
Source name:
World Development Indicators
Source organization:
United Nations Educational, Scientific, and Cultural Organization (UNESCO) Institute for Statistics.
Categories, topics:
Education, Gender
Last updated:
apr 23, 2017
Indicators value changes by year
Minimum:
51.515
jan 1, 2001
Maximum:
62.741
jan 1, 2013
At the date of observation
Value
Absolute change
Change from previous value
jan 1, 2000
51.979
+51.979
0.0%
jan 1, 2001
51.515
-0.464
-0.89%
jan 1, 2002
53.257
+1.742
3.38%
jan 1, 2004
57.491
+4.234
7.95%
jan 1, 2006
51.865
-5.626
-9.79%
jan 1, 2008
54.231
+2.366
4.56%
jan 1, 2009
53.204
-1.027
-1.89%
jan 1, 2010
57.94
+4.736
8.9%
jan 1, 2011
59.179
+1.239
2.14%
jan 1, 2012
59.623
+0.444
0.75%
jan 1, 2013
62.741
+3.117
5.23%
Ranking of countries by current statistics by years


Comments: