29
/
en
AIzaSyAYiBZKx7MnpbEhh9jyipgxe19OcubqV5w
April 1, 2024
212151
Niger
NER
true
2
1
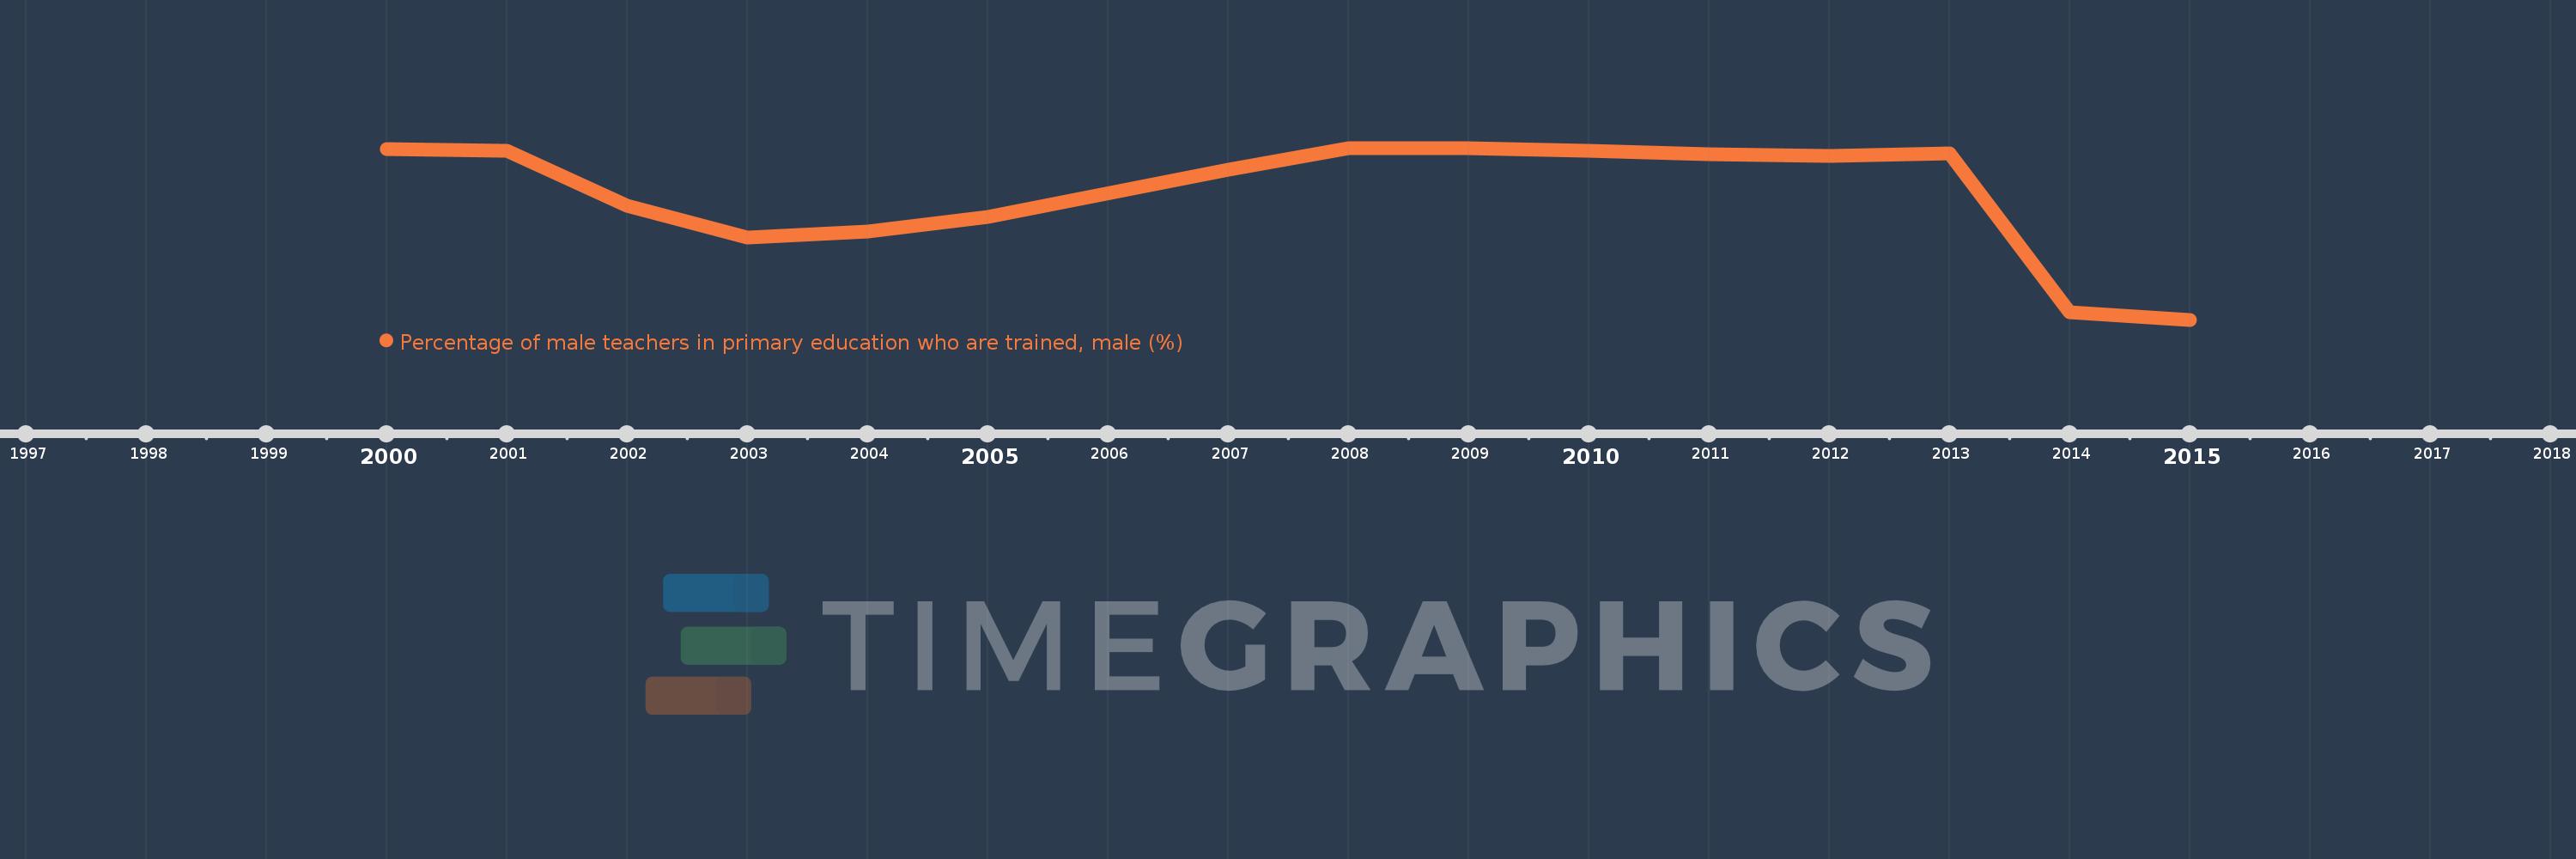
Percentage of male teachers in primary education who are trained, male (%)
2015,2014,2013,2012,2011,2010,2009,2008,2007,2005,2004,2003,2002,2001,2000
This statistics in other country:
Timeline:
This timeline shows a graph from 2000 to 2015 of Niger. No data until 1999. Number of actual observations by date: 15.
Source name:
World Development Indicators
Source organization:
United Nations Educational, Scientific, and Cultural Organization (UNESCO) Institute for Statistics.
Categories, topics:
Education, Gender
Last updated:
apr 23, 2017
Indicators value changes by year
Minimum:
46.542
jan 1, 2015
Maximum:
98.199
jan 1, 2009
At the date of observation
Value
Absolute change
Change from previous value
jan 1, 2000
97.849
+97.849
0.0%
jan 1, 2001
97.416
-0.433
-0.44%
jan 1, 2002
80.753
-16.663
-17.1%
jan 1, 2003
71.299
-9.455
-11.71%
jan 1, 2004
73.164
+1.865
2.62%
jan 1, 2005
77.51
+4.346
5.94%
jan 1, 2007
91.635
+14.125
18.22%
jan 1, 2008
98.019
+6.384
6.97%
jan 1, 2009
98.199
+0.181
0.18%
jan 1, 2010
97.455
-0.744
-0.76%
jan 1, 2011
96.196
-1.26
-1.29%
jan 1, 2012
95.902
-0.294
-0.31%
jan 1, 2013
96.55
+0.647
0.68%
jan 1, 2014
48.687
-47.862
-49.57%
jan 1, 2015
46.542
-2.146
-4.41%
Ranking of countries by current statistics by years


Comments: