29
/
en
AIzaSyAYiBZKx7MnpbEhh9jyipgxe19OcubqV5w
April 1, 2024
173315
Kyrgyz Republic
KGZ
true
2
1
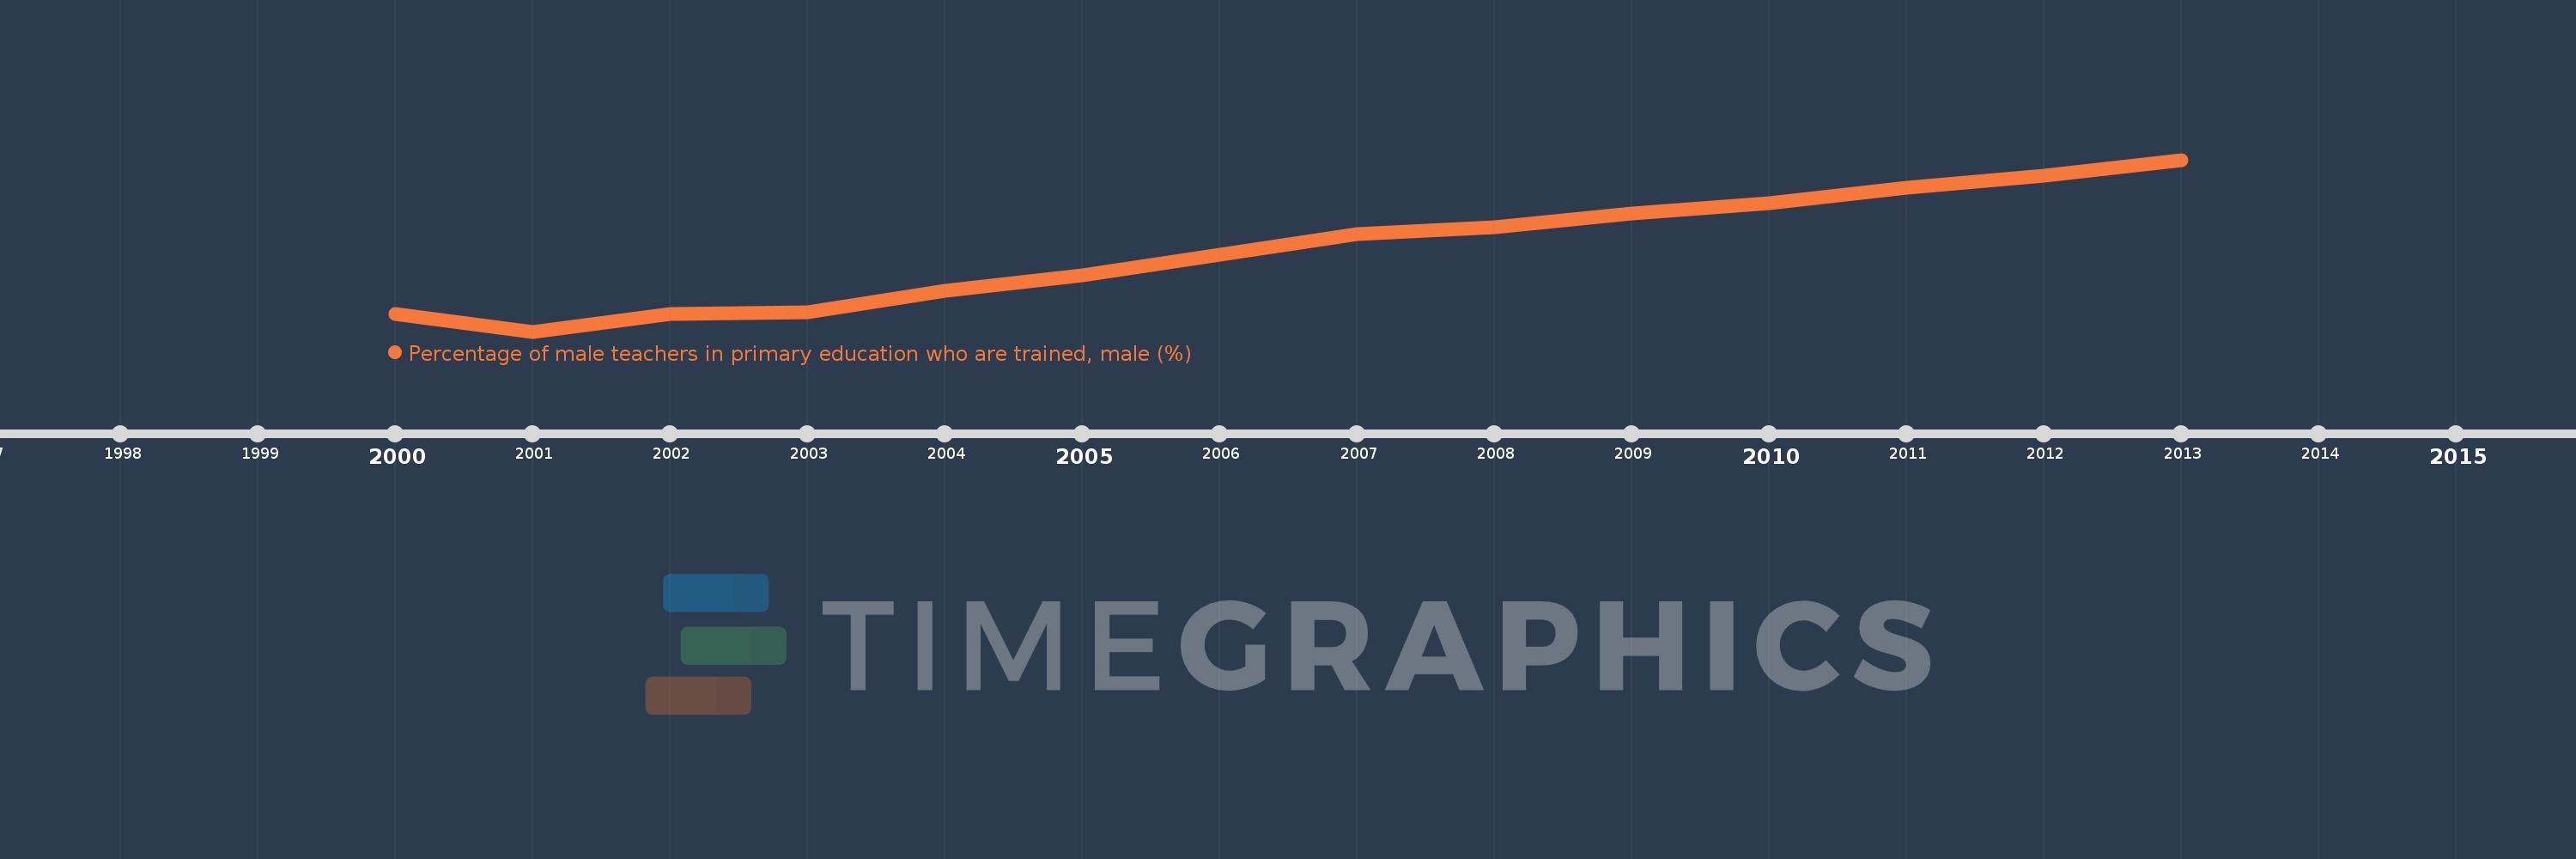
Percentage of male teachers in primary education who are trained, male (%)
2013,2012,2011,2010,2009,2008,2007,2006,2005,2004,2003,2002,2001,2000
This statistics in other country:
Timeline:
This timeline shows a graph from 2000 to 2013 of Kyrgyz Republic. No data until 1999. Number of actual observations by date: 14.
Source name:
World Development Indicators
Source organization:
United Nations Educational, Scientific, and Cultural Organization (UNESCO) Institute for Statistics.
Categories, topics:
Education, Gender
Last updated:
apr 23, 2017
Indicators value changes by year
Minimum:
46.126
jan 1, 2001
Maximum:
72.785
jan 1, 2013
At the date of observation
Value
Absolute change
Change from previous value
jan 1, 2000
48.82
+48.82
0.0%
jan 1, 2001
46.126
-2.694
-5.52%
jan 1, 2002
48.855
+2.729
5.92%
jan 1, 2003
49.155
+0.3
0.61%
jan 1, 2004
52.429
+3.273
6.66%
jan 1, 2005
54.804
+2.375
4.53%
jan 1, 2006
58.031
+3.227
5.89%
jan 1, 2007
61.194
+3.163
5.45%
jan 1, 2008
62.273
+1.079
1.76%
jan 1, 2009
64.467
+2.194
3.52%
jan 1, 2010
66.015
+1.548
2.4%
jan 1, 2011
68.449
+2.435
3.69%
jan 1, 2012
70.288
+1.838
2.69%
jan 1, 2013
72.785
+2.497
3.55%
Ranking of countries by current statistics by years


Comments: