29
/
en
AIzaSyAYiBZKx7MnpbEhh9jyipgxe19OcubqV5w
April 1, 2024
267260
Trinidad and Tobago
TTO
true
2
1
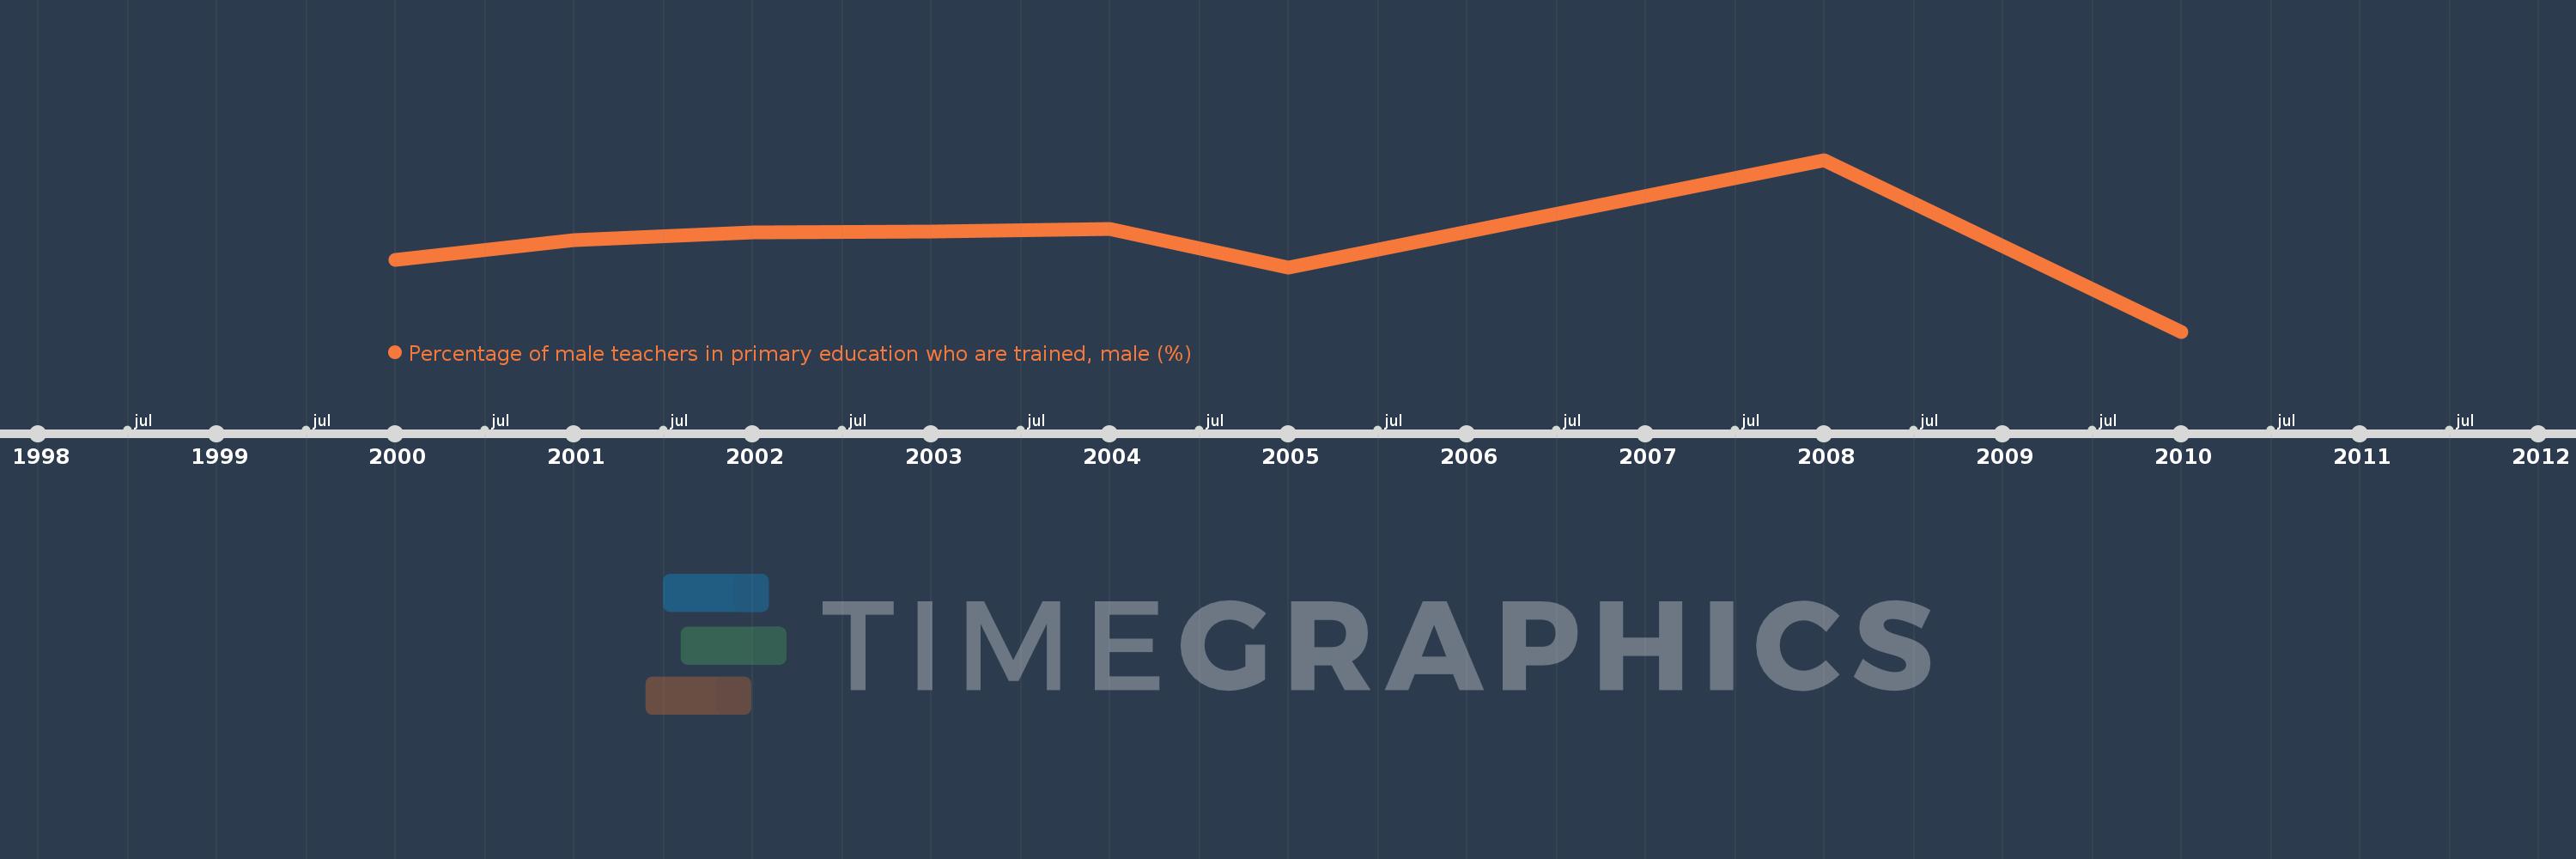
Percentage of male teachers in primary education who are trained, male (%)
2010,2008,2005,2004,2003,2002,2001,2000
This statistics in other country:
Timeline:
This timeline shows a graph from 2000 to 2010 of Trinidad and Tobago. No data until 1999. Number of actual observations by date: 8.
Source name:
World Development Indicators
Source organization:
United Nations Educational, Scientific, and Cultural Organization (UNESCO) Institute for Statistics.
Categories, topics:
Education, Gender
Last updated:
apr 23, 2017
Indicators value changes by year
Minimum:
58.976
jan 1, 2010
Maximum:
94.961
jan 1, 2008
At the date of observation
Value
Absolute change
Change from previous value
jan 1, 2000
73.933
+73.933
0.0%
jan 1, 2001
78.19
+4.257
5.76%
jan 1, 2002
79.691
+1.501
1.92%
jan 1, 2003
79.953
+0.262
0.33%
jan 1, 2004
80.538
+0.585
0.73%
jan 1, 2005
72.301
-8.237
-10.23%
jan 1, 2008
94.961
+22.659
31.34%
jan 1, 2010
58.976
-35.985
-37.89%
Ranking of countries by current statistics by years


Comments: