29
/
en
AIzaSyAYiBZKx7MnpbEhh9jyipgxe19OcubqV5w
April 1, 2024
151919
Hong Kong SAR, China
HKG
true
2
1
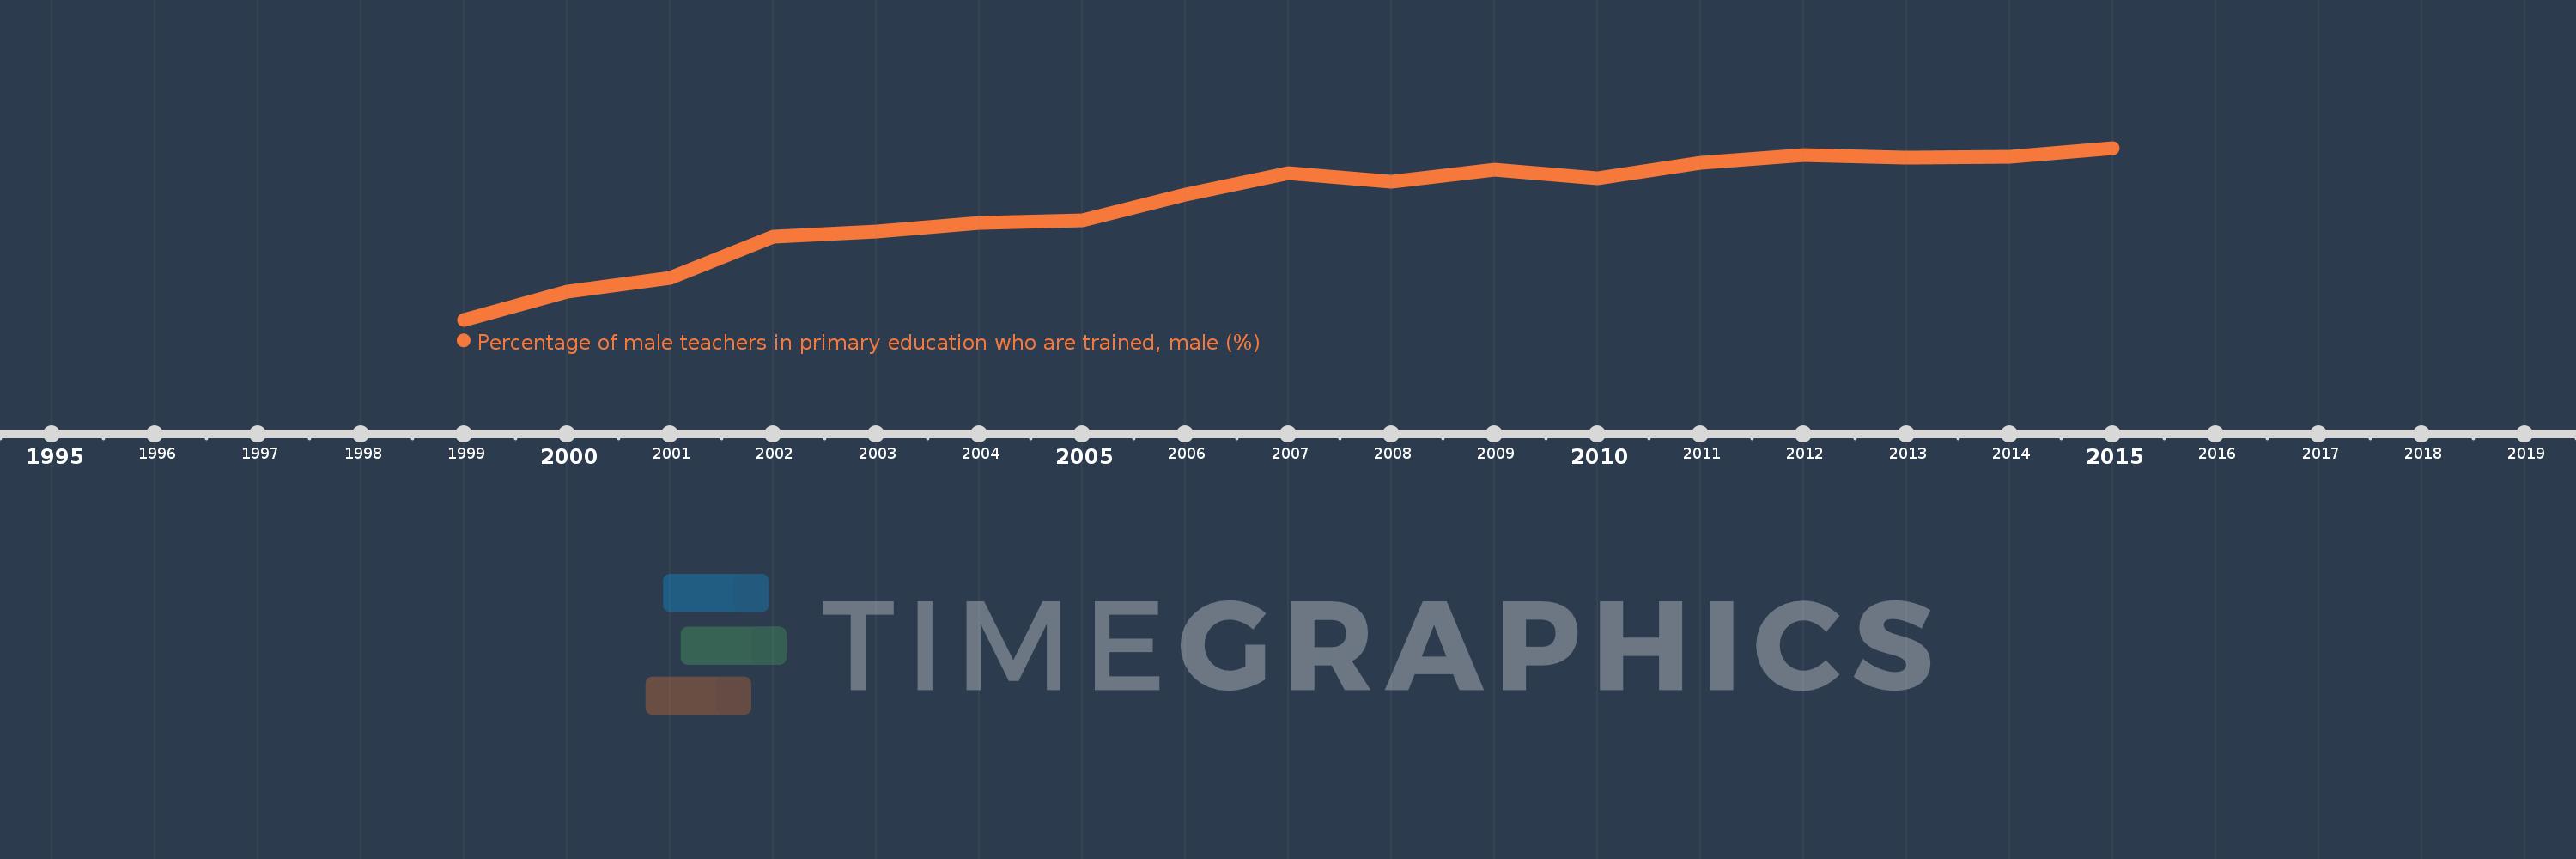
Percentage of male teachers in primary education who are trained, male (%)
2015,2014,2013,2012,2011,2010,2009,2008,2007,2006,2005,2004,2003,2002,2001,2000,1999
This statistics in other country:
Timeline:
This timeline shows a graph from 1999 to 2015 of Hong Kong SAR, China. No data until 1998. Number of actual observations by date: 17.
Source name:
World Development Indicators
Source organization:
United Nations Educational, Scientific, and Cultural Organization (UNESCO) Institute for Statistics.
Categories, topics:
Education, Gender
Last updated:
apr 23, 2017
Indicators value changes by year
Minimum:
85.914
jan 1, 1999
Maximum:
95.206
jan 1, 2015
At the date of observation
Value
Absolute change
Change from previous value
jan 1, 1999
85.914
+85.914
0.0%
jan 1, 2000
87.43
+1.516
1.76%
jan 1, 2001
88.171
+0.741
0.85%
jan 1, 2002
90.411
+2.24
2.54%
jan 1, 2003
90.674
+0.263
0.29%
jan 1, 2004
91.127
+0.453
0.5%
jan 1, 2005
91.278
+0.151
0.17%
jan 1, 2006
92.685
+1.407
1.54%
jan 1, 2007
93.862
+1.177
1.27%
jan 1, 2008
93.38
-0.482
-0.51%
jan 1, 2009
94.051
+0.671
0.72%
jan 1, 2010
93.587
-0.464
-0.49%
jan 1, 2011
94.389
+0.802
0.86%
jan 1, 2012
94.821
+0.432
0.46%
jan 1, 2013
94.703
-0.118
-0.12%
jan 1, 2014
94.724
+0.022
0.02%
jan 1, 2015
95.206
+0.481
0.51%
Ranking of countries by current statistics by years


Comments: