29
/
en
AIzaSyAYiBZKx7MnpbEhh9jyipgxe19OcubqV5w
April 1, 2024
40224
IDA total
IDA
false
2
1
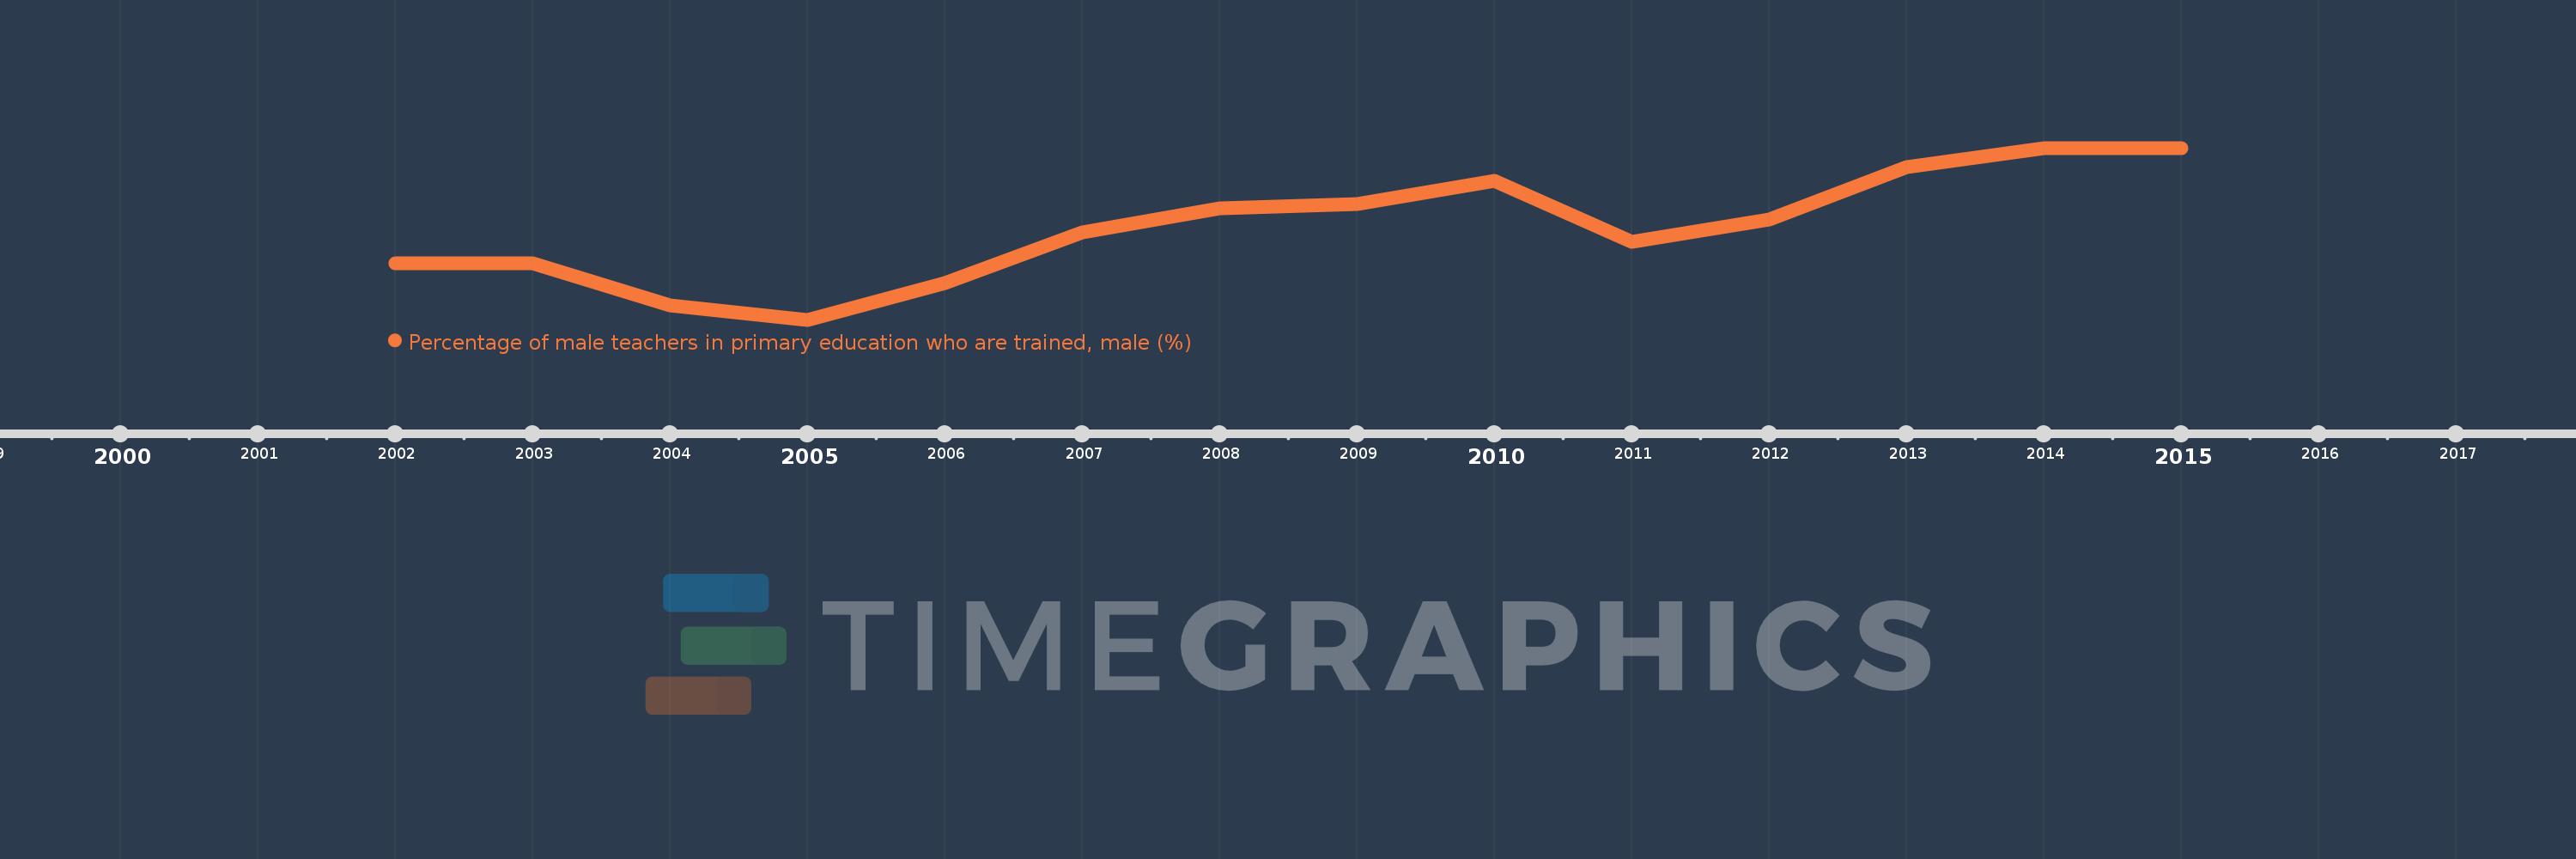
Percentage of male teachers in primary education who are trained, male (%)
2015,2014,2013,2012,2011,2010,2009,2008,2007,2006,2005,2004,2003,2002
This statistics in other country:
Timeline:
This timeline shows a graph from 2002 to 2015 of IDA total. No data until 2001. Number of actual observations by date: 14.
Source name:
World Development Indicators
Source organization:
United Nations Educational, Scientific, and Cultural Organization (UNESCO) Institute for Statistics.
Categories, topics:
Education, Gender
Last updated:
apr 23, 2017
Indicators value changes by year
Minimum:
71.709
jan 1, 2005
Maximum:
76.778
jan 1, 2014
At the date of observation
Value
Absolute change
Change from previous value
jan 1, 2002
73.384
+73.384
0.0%
jan 1, 2003
73.369
-0.015
-0.02%
jan 1, 2004
72.13
-1.239
-1.69%
jan 1, 2005
71.709
-0.422
-0.58%
jan 1, 2006
72.803
+1.094
1.53%
jan 1, 2007
74.295
+1.492
2.05%
jan 1, 2008
74.989
+0.694
0.93%
jan 1, 2009
75.133
+0.144
0.19%
jan 1, 2010
75.814
+0.681
0.91%
jan 1, 2011
74.02
-1.794
-2.37%
jan 1, 2012
74.675
+0.655
0.88%
jan 1, 2013
76.213
+1.538
2.06%
jan 1, 2014
76.778
+0.564
0.74%
jan 1, 2015
76.771
-0.007
-0.01%
Ranking of countries by current statistics by years


Comments: