29
/
en
AIzaSyAYiBZKx7MnpbEhh9jyipgxe19OcubqV5w
April 1, 2024
122609
Dominican Republic
DOM
true
2
1
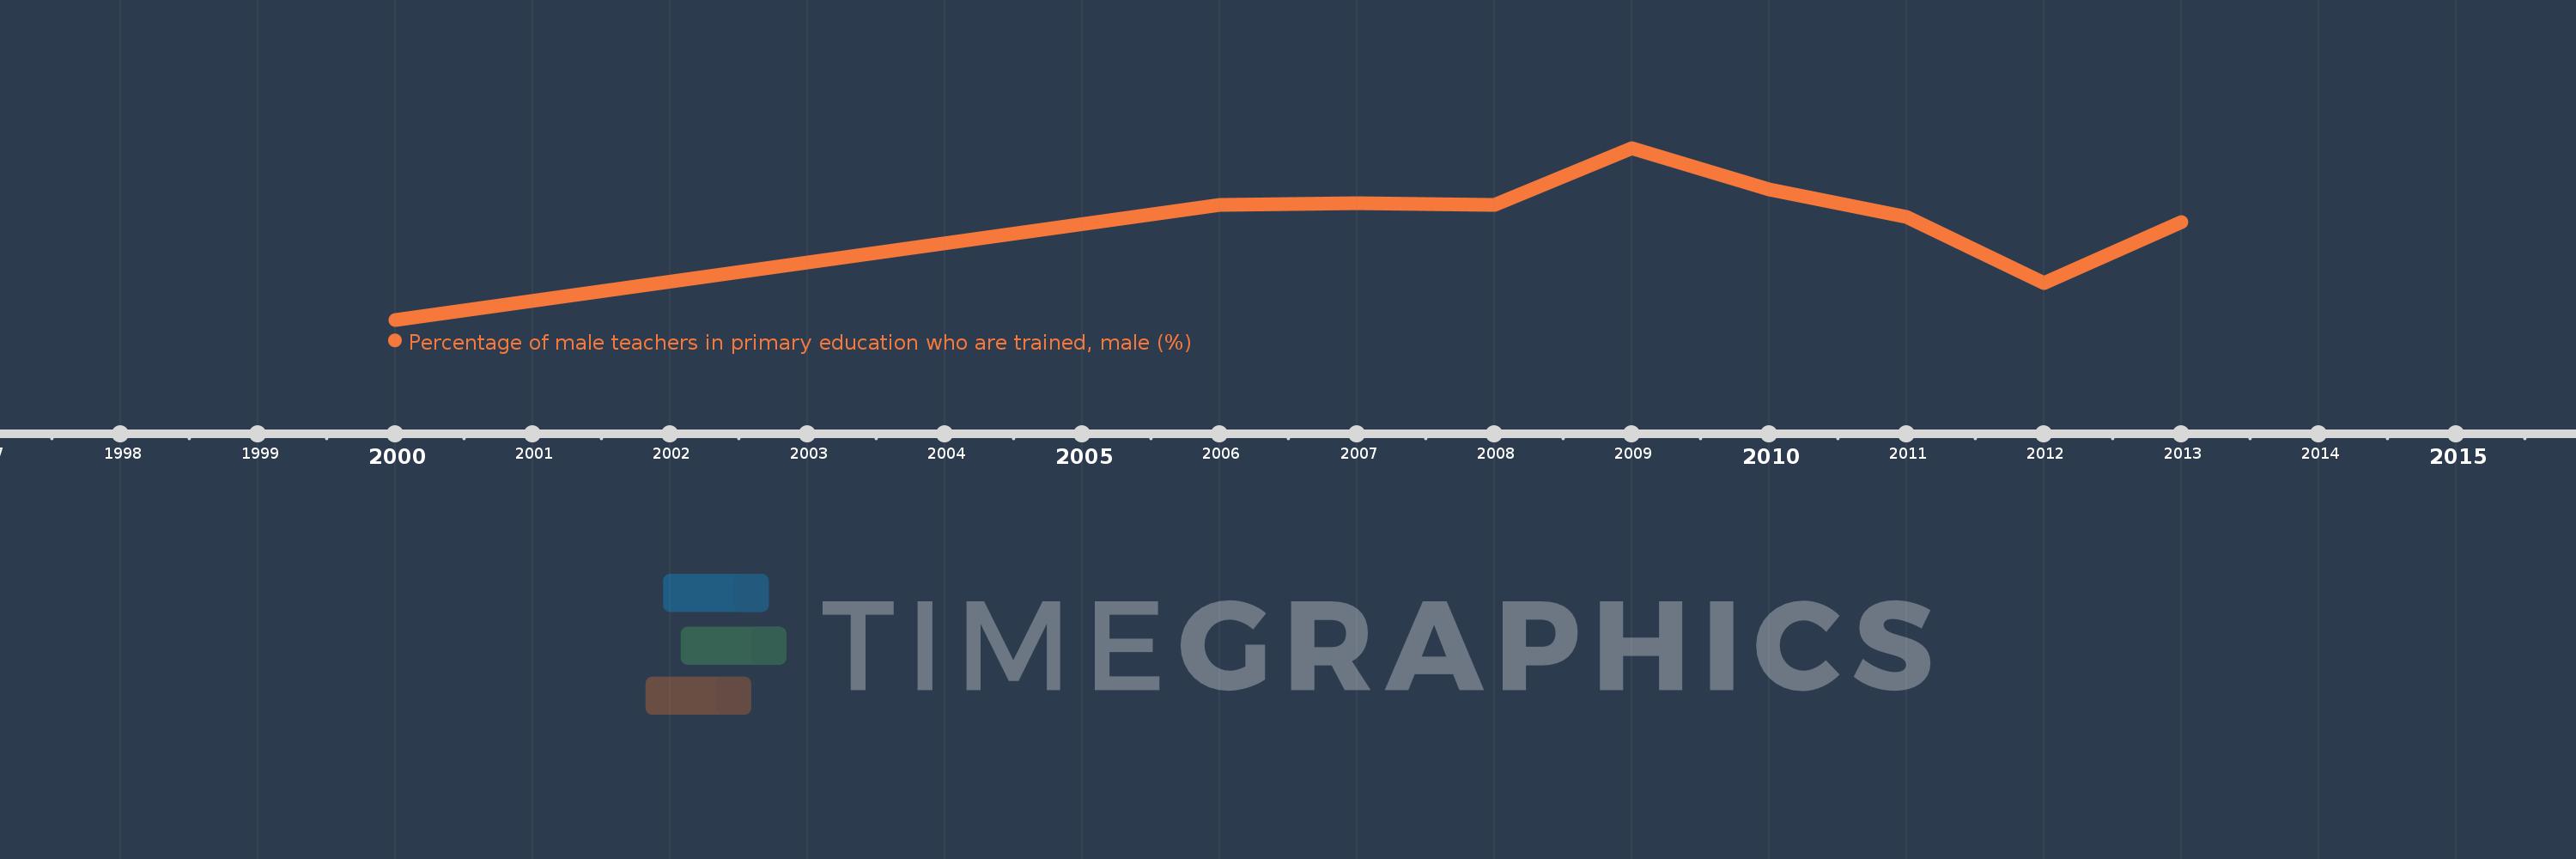
Percentage of male teachers in primary education who are trained, male (%)
2013,2012,2011,2010,2009,2008,2007,2006,2000
This statistics in other country:
Timeline:
This timeline shows a graph from 2000 to 2013 of Dominican Republic. No data until 1999. Number of actual observations by date: 9.
Source name:
World Development Indicators
Source organization:
United Nations Educational, Scientific, and Cultural Organization (UNESCO) Institute for Statistics.
Categories, topics:
Education, Gender
Last updated:
apr 23, 2017
Indicators value changes by year
Minimum:
64.137
jan 1, 2000
Maximum:
89.742
jan 1, 2009
At the date of observation
Value
Absolute change
Change from previous value
jan 1, 2000
64.137
+64.137
0.0%
jan 1, 2006
81.26
+17.123
26.7%
jan 1, 2007
81.487
+0.228
0.28%
jan 1, 2008
81.259
-0.228
-0.28%
jan 1, 2009
89.742
+8.483
10.44%
jan 1, 2010
83.609
-6.133
-6.83%
jan 1, 2011
79.411
-4.198
-5.02%
jan 1, 2012
69.664
-9.746
-12.27%
jan 1, 2013
78.643
+8.979
12.89%
Ranking of countries by current statistics by years


Comments: