29
/
en
AIzaSyAYiBZKx7MnpbEhh9jyipgxe19OcubqV5w
April 1, 2024
40413
IDA total
IDA
false
2
1
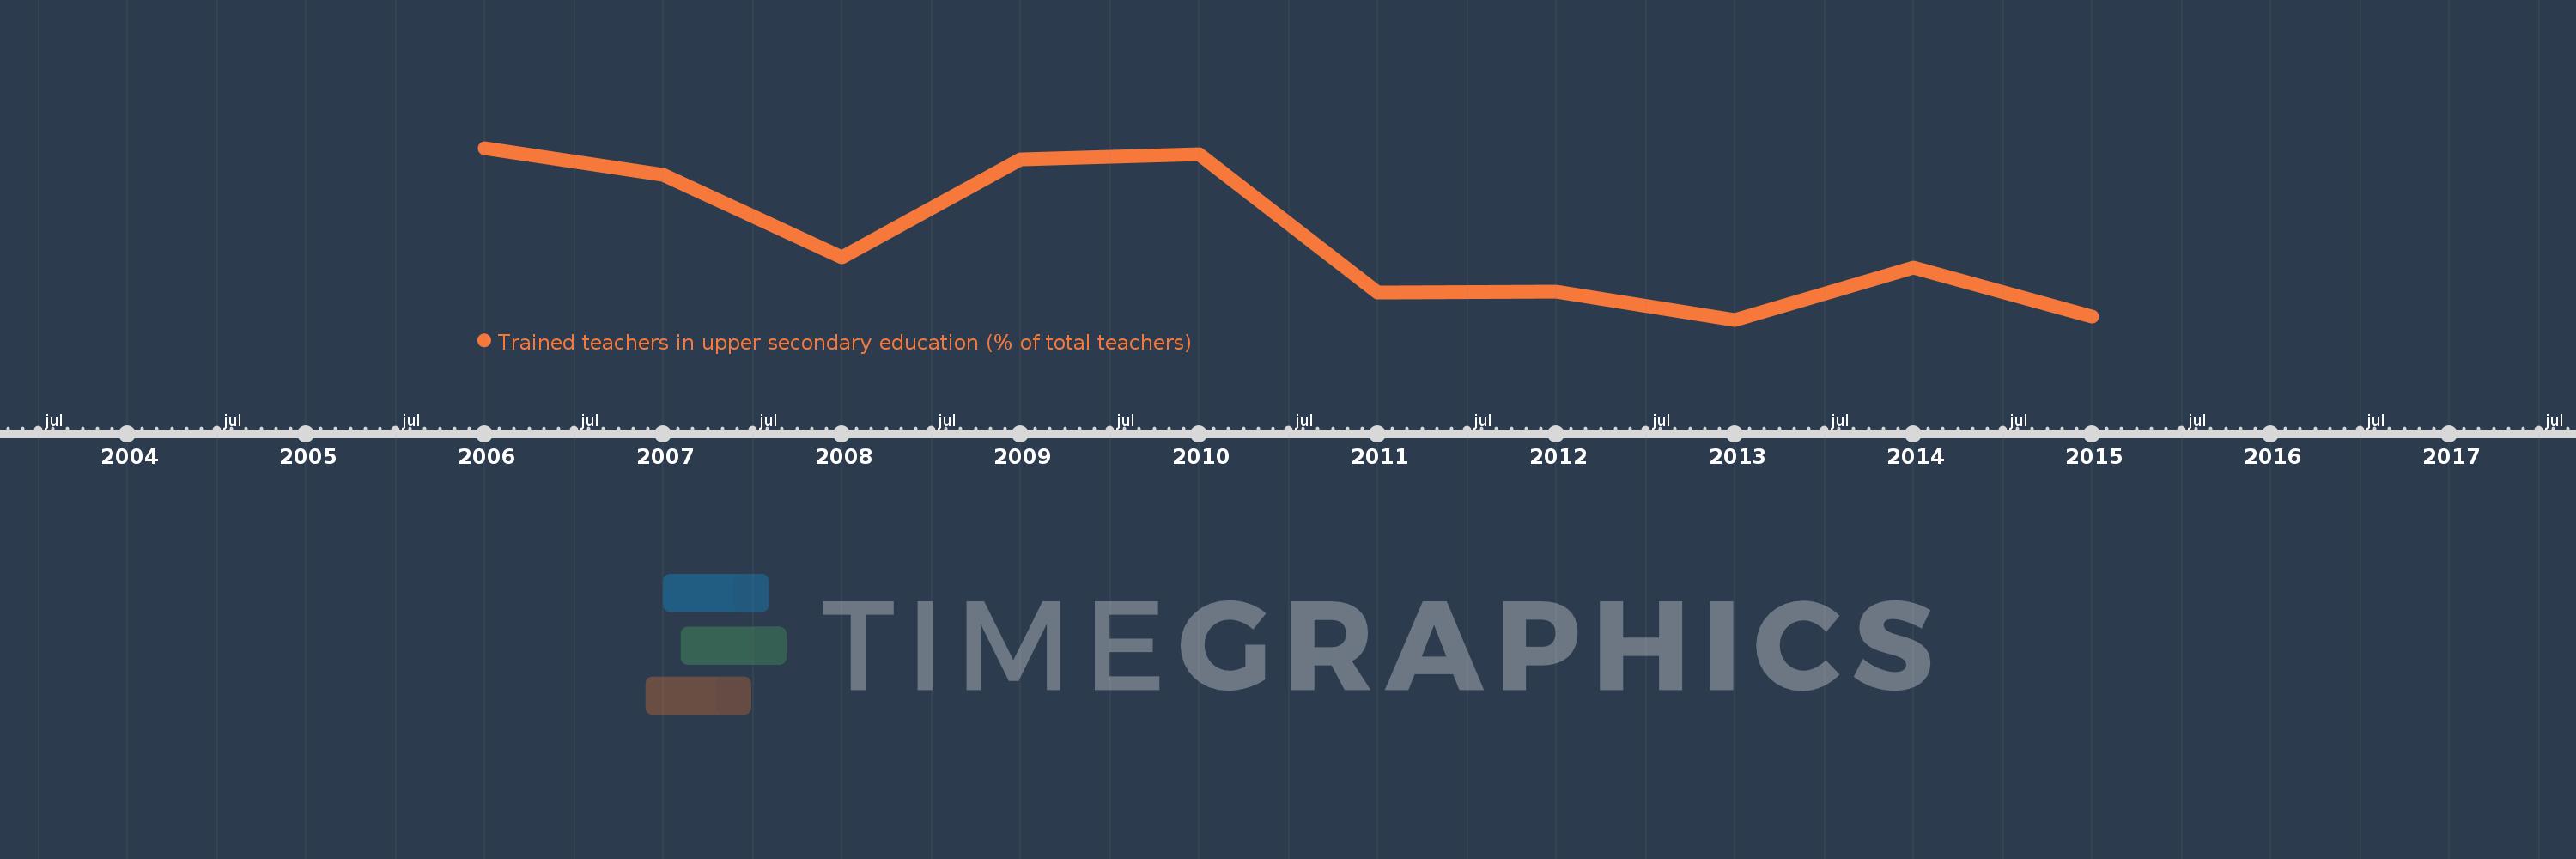
Trained teachers in upper secondary education (% of total teachers)
2015,2014,2013,2012,2011,2010,2009,2008,2007,2006
This statistics in other country:
Timeline:
This timeline shows a graph from 2006 to 2015 of IDA total. No data until 2005. Number of actual observations by date: 10.
Source name:
World Development Indicators
Source organization:
United Nations Educational, Scientific, and Cultural Organization (UNESCO) Institute for Statistics.
Categories, topics:
Education
Last updated:
apr 23, 2017
Indicators value changes by year
Minimum:
58.801
jan 1, 2013
Maximum:
67.982
jan 1, 2006
At the date of observation
Value
Absolute change
Change from previous value
jan 1, 2006
67.982
+67.982
0.0%
jan 1, 2007
66.538
-1.444
-2.12%
jan 1, 2008
62.157
-4.381
-6.58%
jan 1, 2009
67.372
+5.215
8.39%
jan 1, 2010
67.625
+0.253
0.37%
jan 1, 2011
60.246
-7.379
-10.91%
jan 1, 2012
60.302
+0.056
0.09%
jan 1, 2013
58.801
-1.501
-2.49%
jan 1, 2014
61.604
+2.803
4.77%
jan 1, 2015
58.954
-2.65
-4.3%
Ranking of countries by current statistics by years


Comments: