29
/
en
AIzaSyAYiBZKx7MnpbEhh9jyipgxe19OcubqV5w
April 1, 2024
38661
IDA blend
IDB
false
2
1
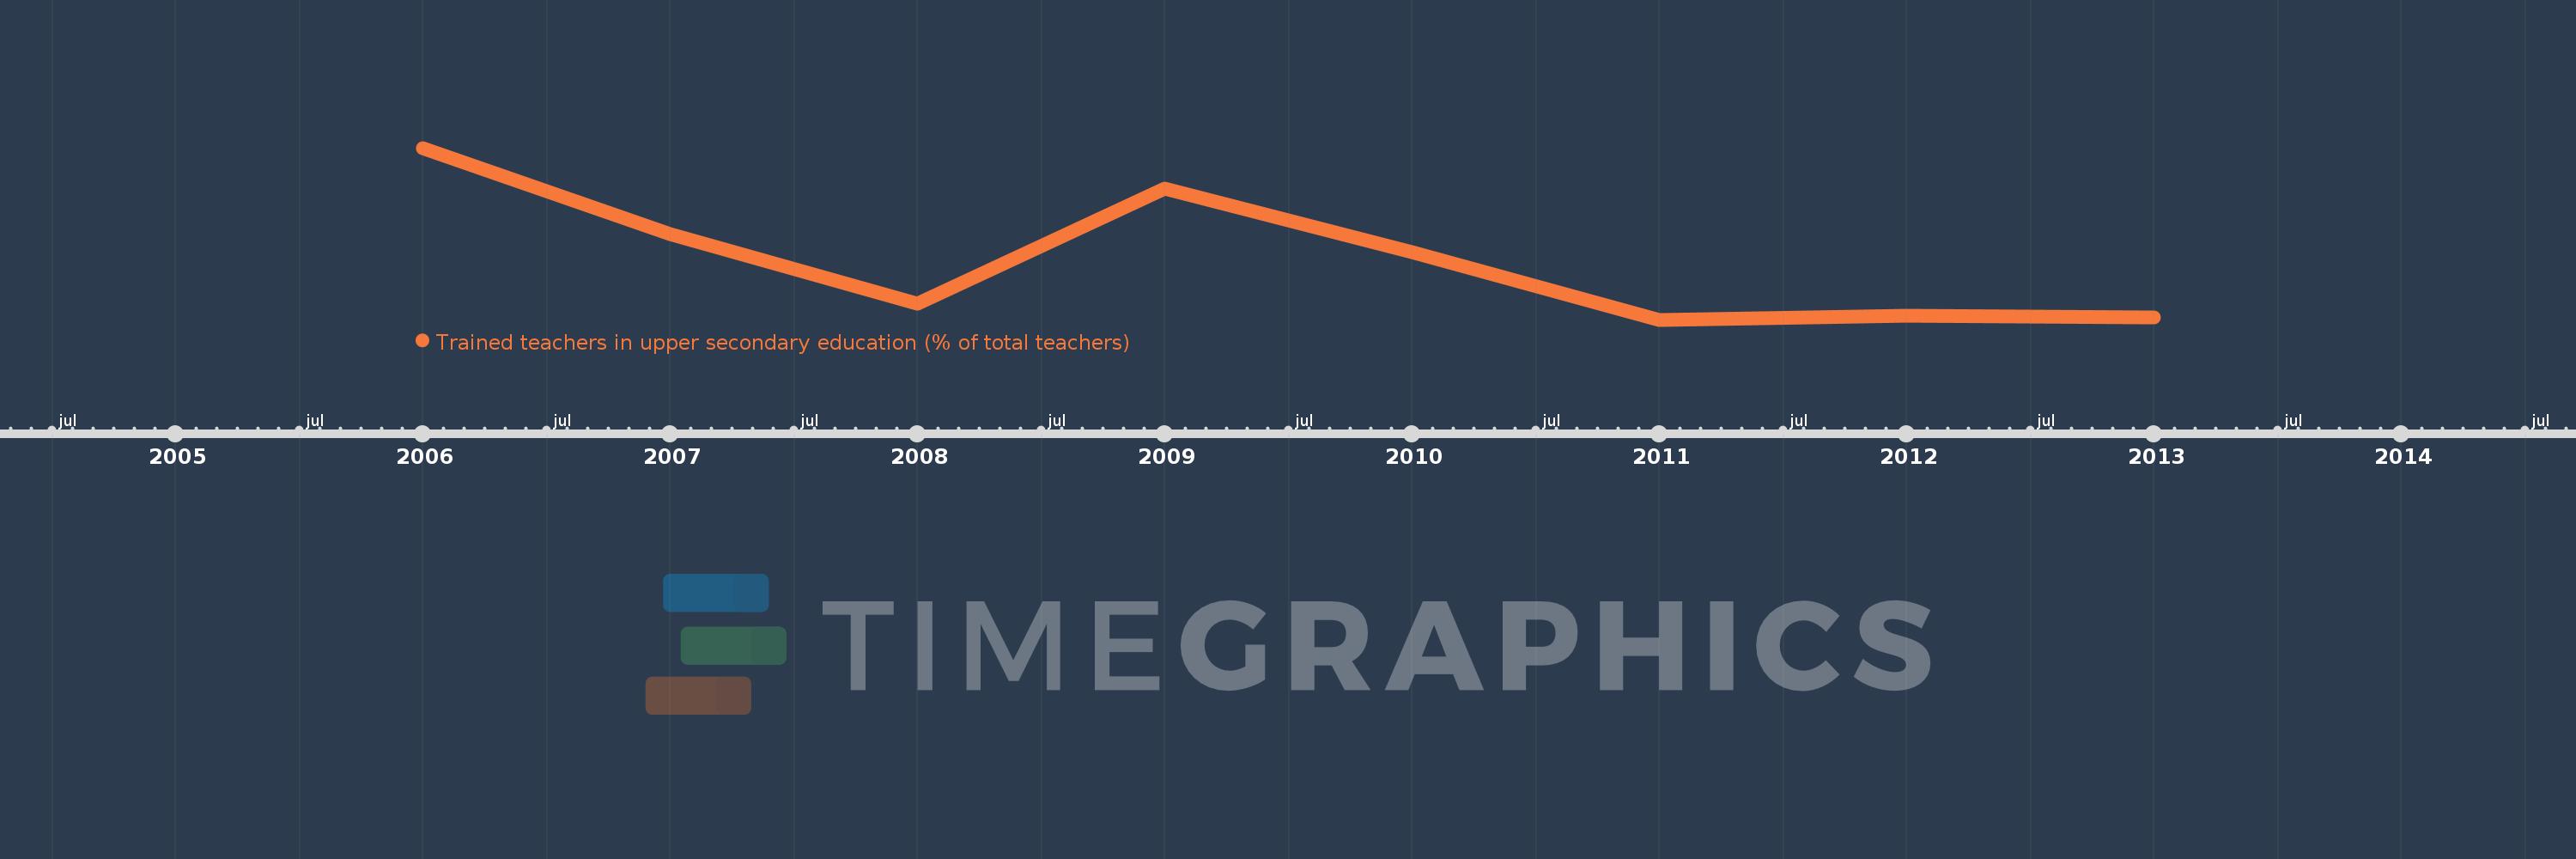
Trained teachers in upper secondary education (% of total teachers)
2013,2012,2011,2010,2009,2008,2007,2006
This statistics in other country:
Timeline:
This timeline shows a graph from 2006 to 2013 of IDA blend. No data until 2005. Number of actual observations by date: 8.
Source name:
World Development Indicators
Source organization:
United Nations Educational, Scientific, and Cultural Organization (UNESCO) Institute for Statistics.
Categories, topics:
Education
Last updated:
apr 23, 2017
Indicators value changes by year
Minimum:
71.155
jan 1, 2011
Maximum:
87.361
jan 1, 2006
At the date of observation
Value
Absolute change
Change from previous value
jan 1, 2006
87.361
+87.361
0.0%
jan 1, 2007
79.212
-8.149
-9.33%
jan 1, 2008
72.642
-6.57
-8.29%
jan 1, 2009
83.52
+10.878
14.97%
jan 1, 2010
77.504
-6.016
-7.2%
jan 1, 2011
71.155
-6.349
-8.19%
jan 1, 2012
71.54
+0.385
0.54%
jan 1, 2013
71.382
-0.158
-0.22%
Ranking of countries by current statistics by years


Comments: