29
/
en
AIzaSyAYiBZKx7MnpbEhh9jyipgxe19OcubqV5w
April 1, 2024
59431
Sub-Saharan Africa
SSF
false
2
1
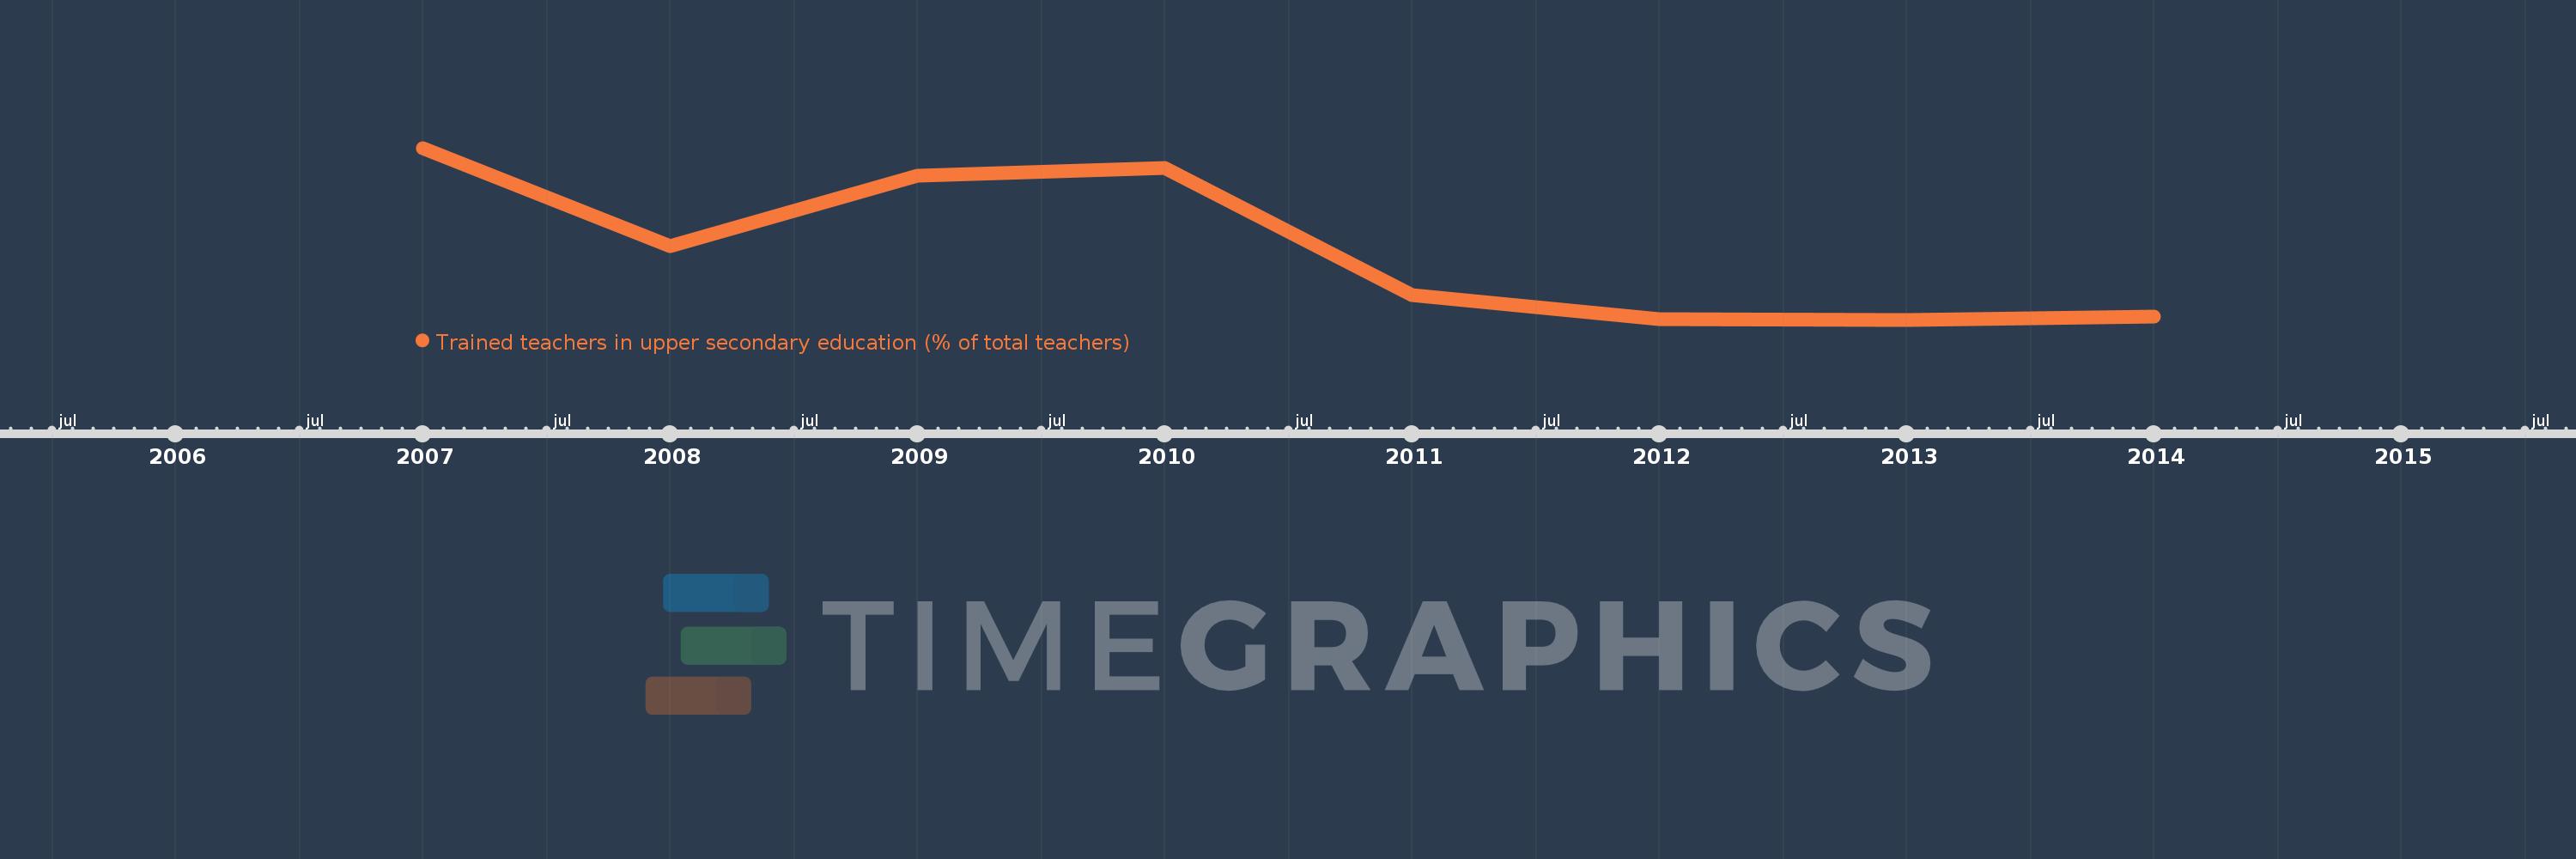
Trained teachers in upper secondary education (% of total teachers)
2014,2013,2012,2011,2010,2009,2008,2007
This statistics in other country:
Timeline:
This timeline shows a graph from 2007 to 2014 of Sub-Saharan Africa . No data until 2006. Number of actual observations by date: 8.
Source name:
World Development Indicators
Source organization:
United Nations Educational, Scientific, and Cultural Organization (UNESCO) Institute for Statistics.
Categories, topics:
Education
Last updated:
apr 23, 2017
Indicators value changes by year
Minimum:
51.002
jan 1, 2013
At the date of observation
Value
Absolute change
Change from previous value
jan 1, 2007
70.32
+70.32
0.0%
jan 1, 2008
59.309
-11.012
-15.66%
jan 1, 2009
67.191
+7.882
13.29%
jan 1, 2010
68.073
+0.882
1.31%
jan 1, 2011
53.734
-14.339
-21.06%
jan 1, 2012
51.077
-2.657
-4.95%
jan 1, 2013
51.002
-0.075
-0.15%
jan 1, 2014
51.362
+0.36
0.71%
Ranking of countries by current statistics by years


Comments: