29
/
en
AIzaSyAYiBZKx7MnpbEhh9jyipgxe19OcubqV5w
April 1, 2024
83582
Belize
BLZ
true
2
1
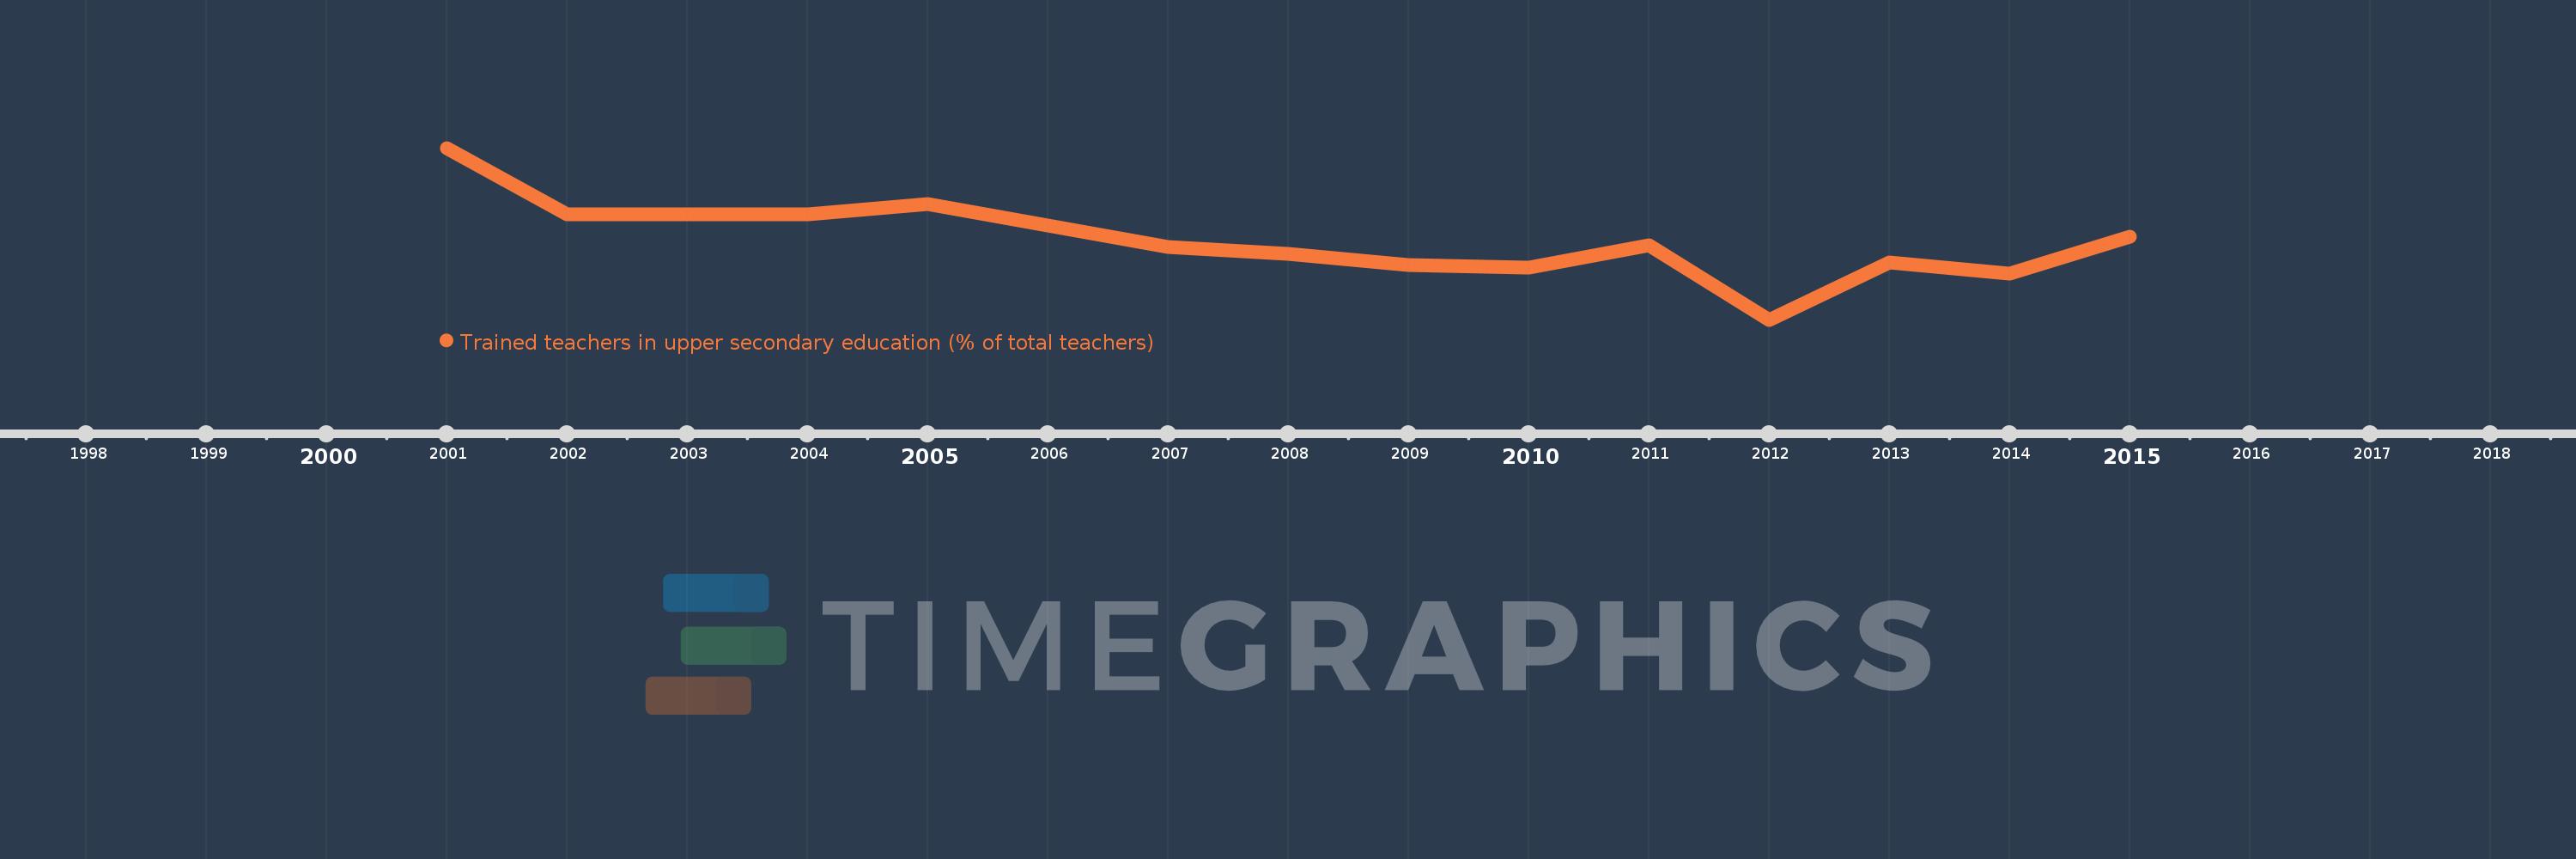
Trained teachers in upper secondary education (% of total teachers)
2015,2014,2013,2012,2011,2010,2009,2008,2007,2005,2004,2002,2001
This statistics in other country:
Timeline:
This timeline shows a graph from 2001 to 2015 of Belize. No data until 2000. Number of actual observations by date: 13.
Source name:
World Development Indicators
Source organization:
United Nations Educational, Scientific, and Cultural Organization (UNESCO) Institute for Statistics.
Categories, topics:
Education
Last updated:
apr 23, 2017
Indicators value changes by year
Minimum:
18.914
jan 1, 2012
Maximum:
54.717
jan 1, 2001
At the date of observation
Value
Absolute change
Change from previous value
jan 1, 2001
54.717
+54.717
0.0%
jan 1, 2002
40.889
-13.828
-25.27%
jan 1, 2004
40.94
+0.051
0.12%
jan 1, 2005
43.077
+2.137
5.22%
jan 1, 2007
34.141
-8.936
-20.74%
jan 1, 2008
32.689
-1.453
-4.26%
jan 1, 2009
30.333
-2.356
-7.21%
jan 1, 2010
29.709
-0.624
-2.06%
jan 1, 2011
34.442
+4.734
15.93%
jan 1, 2012
18.914
-15.528
-45.09%
jan 1, 2013
30.94
+12.026
63.58%
jan 1, 2014
28.499
-2.441
-7.89%
jan 1, 2015
36.192
+7.693
26.99%
Ranking of countries by current statistics by years


Comments: