29
/
en
AIzaSyAYiBZKx7MnpbEhh9jyipgxe19OcubqV5w
April 1, 2024
204834
Myanmar
MMR
true
2
1
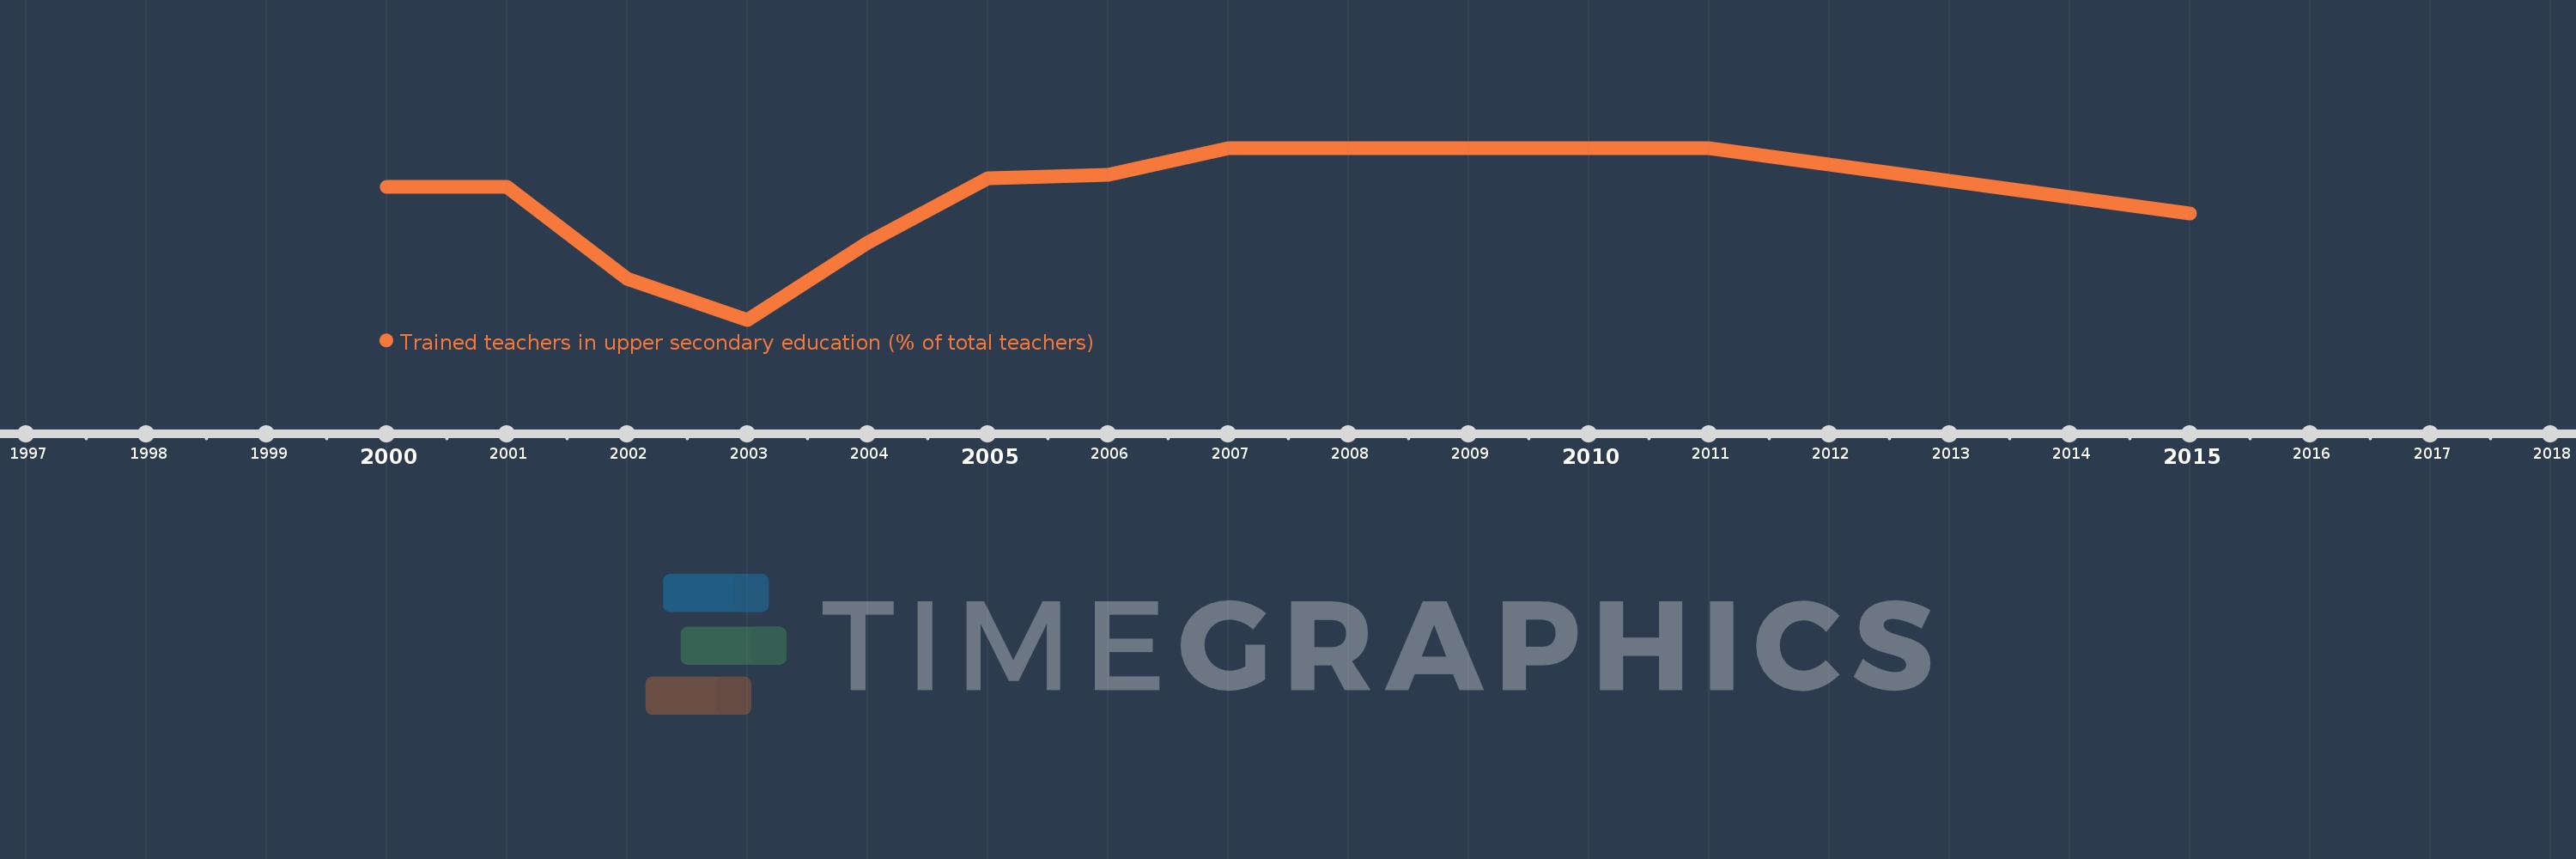
Trained teachers in upper secondary education (% of total teachers)
2015,2011,2010,2009,2008,2007,2006,2005,2004,2003,2002,2001,2000
This statistics in other country:
Timeline:
This timeline shows a graph from 2000 to 2015 of Myanmar. No data until 1999. Number of actual observations by date: 13.
Source name:
World Development Indicators
Source organization:
United Nations Educational, Scientific, and Cultural Organization (UNESCO) Institute for Statistics.
Categories, topics:
Education
Last updated:
apr 23, 2017
Indicators value changes by year
Minimum:
87.253
jan 1, 2003
At the date of observation
Value
Absolute change
Change from previous value
jan 1, 2000
97.132
+97.132
0.0%
jan 1, 2001
97.131
-0.001
0.0%
jan 1, 2002
90.297
-6.834
-7.04%
jan 1, 2003
87.253
-3.044
-3.37%
jan 1, 2004
92.999
+5.746
6.59%
jan 1, 2005
97.782
+4.782
5.14%
jan 1, 2006
98.001
+0.219
0.22%
jan 1, 2007
100.0
+1.999
2.04%
jan 1, 2008
100.0
0.0
0.0%
jan 1, 2009
100.0
0.0
0.0%
jan 1, 2010
100.0
0.0
0.0%
jan 1, 2011
100.0
0.0
0.0%
jan 1, 2015
95.159
-4.841
-4.84%
Ranking of countries by current statistics by years


Comments: