29
/
en
AIzaSyAYiBZKx7MnpbEhh9jyipgxe19OcubqV5w
April 1, 2024
25393
Caribbean small states
CSS
false
2
1
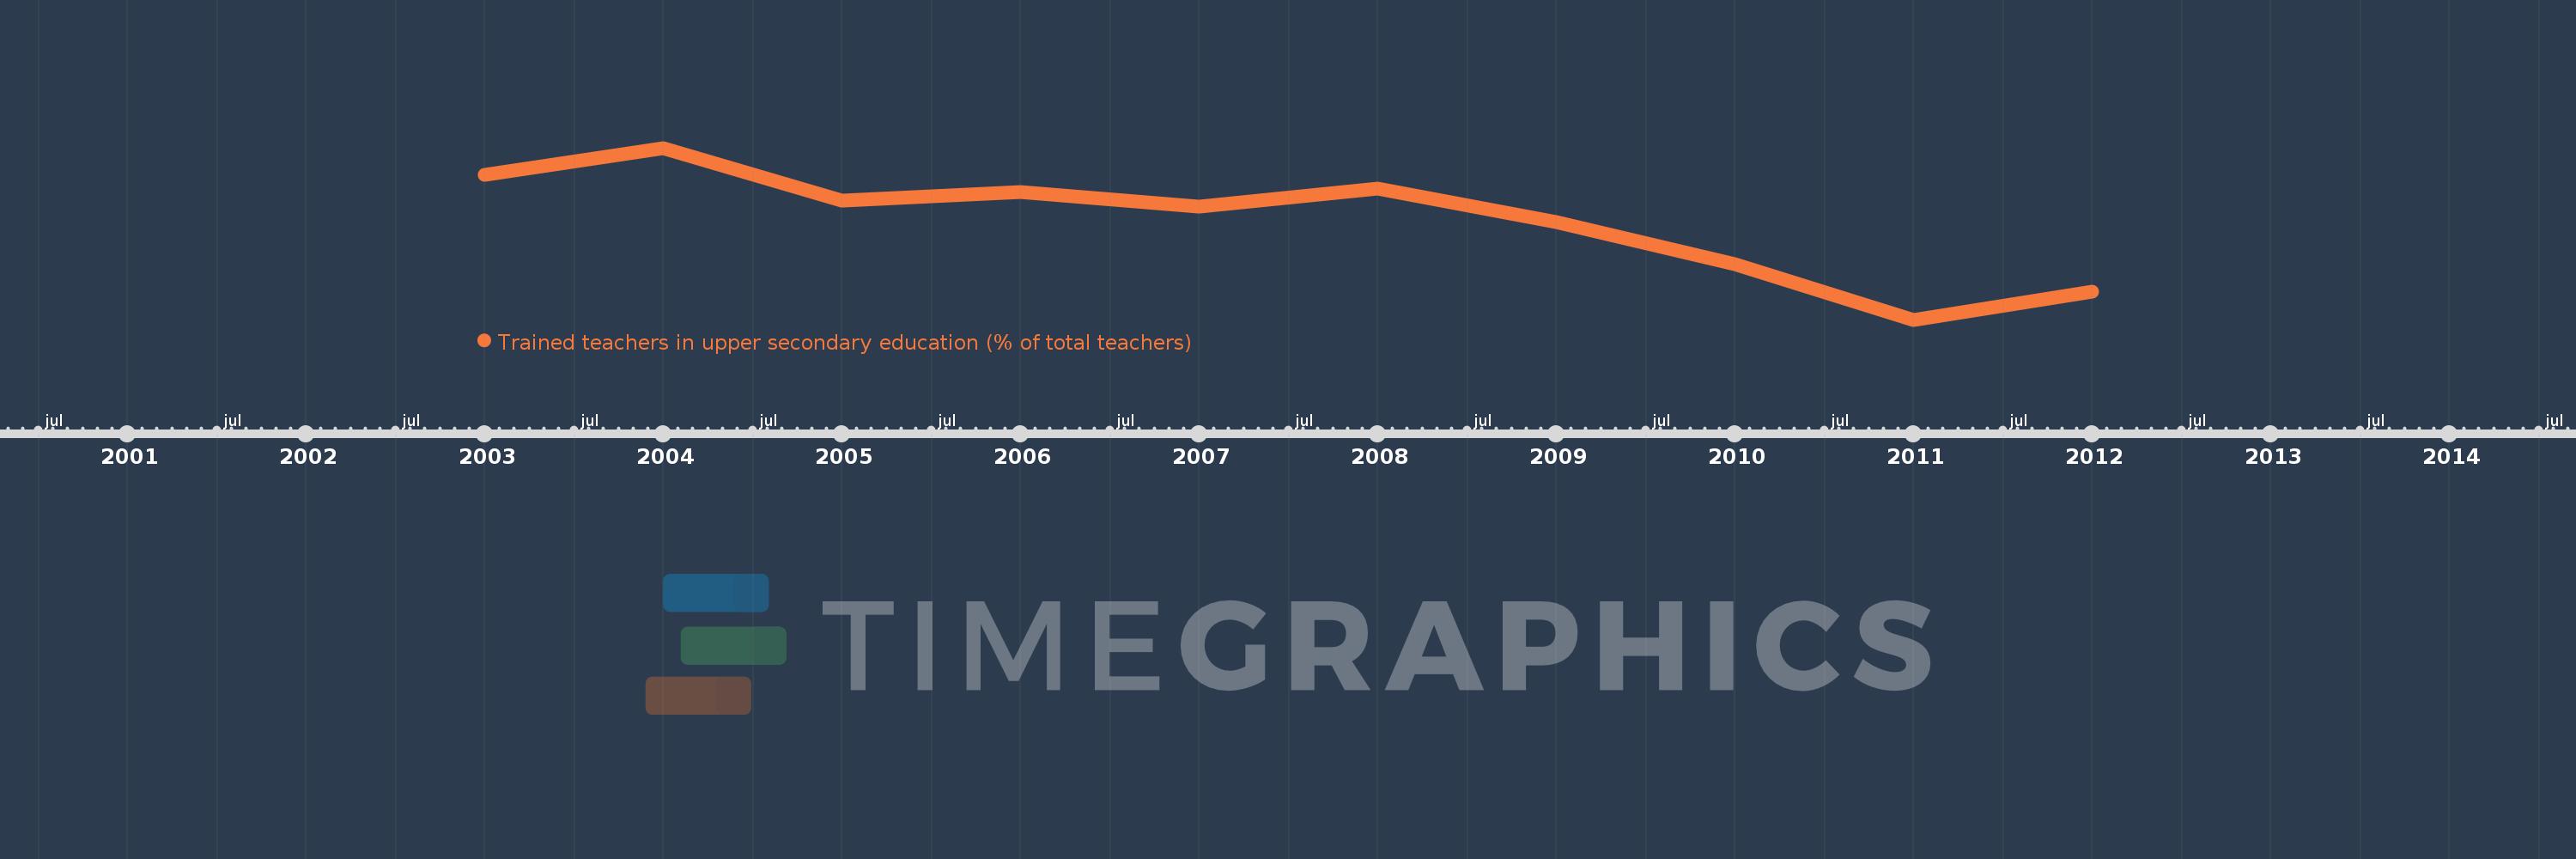
Trained teachers in upper secondary education (% of total teachers)
2012,2011,2010,2009,2008,2007,2006,2005,2004,2003
This statistics in other country:
Timeline:
This timeline shows a graph from 2003 to 2012 of Caribbean small states. No data until 2002. Number of actual observations by date: 10.
Source name:
World Development Indicators
Source organization:
United Nations Educational, Scientific, and Cultural Organization (UNESCO) Institute for Statistics.
Categories, topics:
Education
Last updated:
apr 23, 2017
Indicators value changes by year
Minimum:
65.013
jan 1, 2011
Maximum:
105.474
jan 1, 2004
At the date of observation
Value
Absolute change
Change from previous value
jan 1, 2003
99.113
+99.113
0.0%
jan 1, 2004
105.474
+6.36
6.42%
jan 1, 2005
93.134
-12.339
-11.7%
jan 1, 2006
95.021
+1.887
2.03%
jan 1, 2007
91.654
-3.367
-3.54%
jan 1, 2008
96.001
+4.347
4.74%
jan 1, 2009
88.002
-7.999
-8.33%
jan 1, 2010
78.036
-9.966
-11.32%
jan 1, 2011
65.013
-13.023
-16.69%
jan 1, 2012
71.684
+6.671
10.26%
Ranking of countries by current statistics by years


Comments: