29
/
en
AIzaSyAYiBZKx7MnpbEhh9jyipgxe19OcubqV5w
April 1, 2024
174906
Lao PDR
LAO
true
2
1
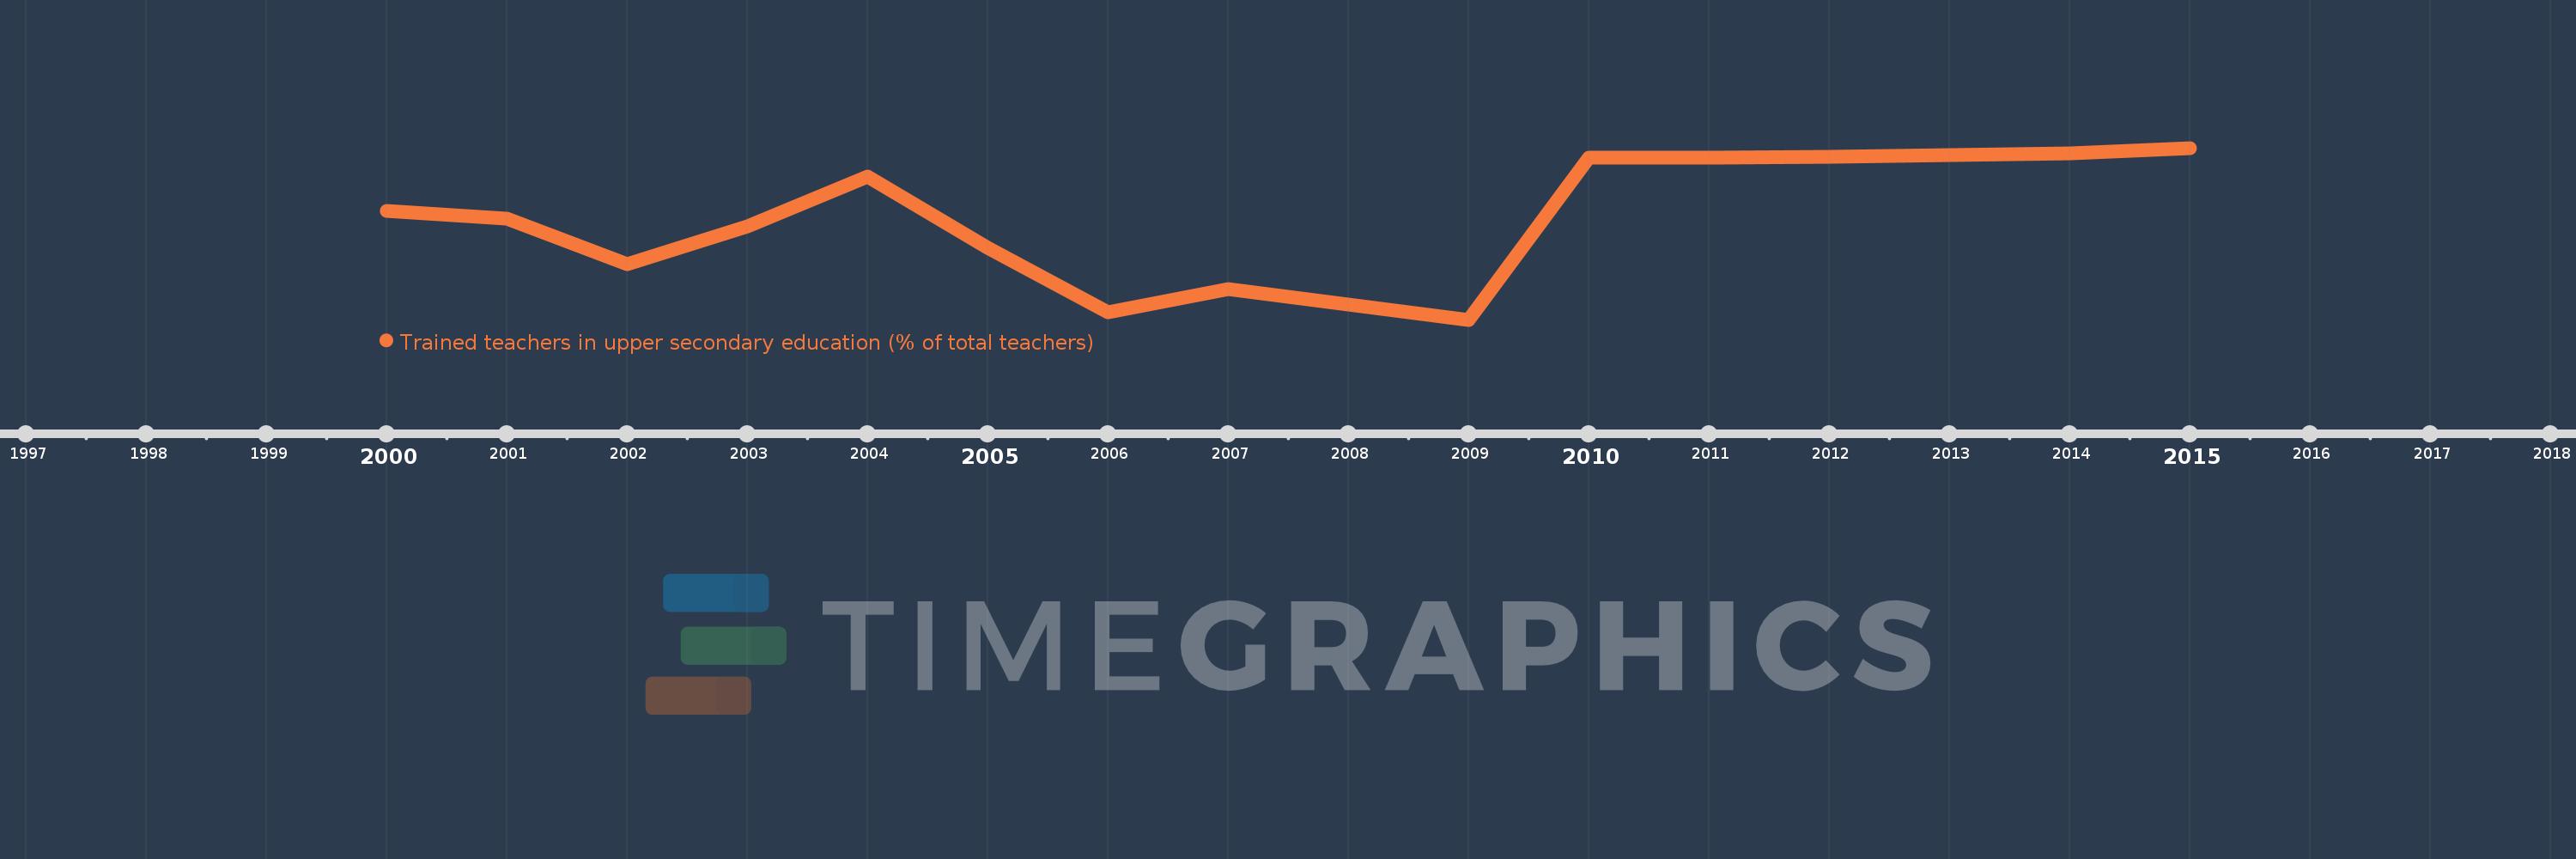
Trained teachers in upper secondary education (% of total teachers)
2015,2014,2013,2012,2011,2010,2009,2007,2006,2005,2004,2003,2002,2001,2000
This statistics in other country:
Timeline:
This timeline shows a graph from 2000 to 2015 of Lao PDR. No data until 1999. Number of actual observations by date: 15.
Source name:
World Development Indicators
Source organization:
United Nations Educational, Scientific, and Cultural Organization (UNESCO) Institute for Statistics.
Categories, topics:
Education
Last updated:
apr 23, 2017
Indicators value changes by year
Minimum:
89.351
jan 1, 2009
Maximum:
99.936
jan 1, 2015
At the date of observation
Value
Absolute change
Change from previous value
jan 1, 2000
96.055
+96.055
0.0%
jan 1, 2001
95.565
-0.489
-0.51%
jan 1, 2002
92.789
-2.776
-2.91%
jan 1, 2003
95.098
+2.309
2.49%
jan 1, 2004
98.184
+3.086
3.24%
jan 1, 2005
93.772
-4.411
-4.49%
jan 1, 2006
89.814
-3.959
-4.22%
jan 1, 2007
91.222
+1.408
1.57%
jan 1, 2009
89.351
-1.871
-2.05%
jan 1, 2010
99.336
+9.985
11.17%
jan 1, 2011
99.355
+0.019
0.02%
jan 1, 2012
99.417
+0.062
0.06%
jan 1, 2013
99.482
+0.065
0.07%
jan 1, 2014
99.625
+0.143
0.14%
jan 1, 2015
99.936
+0.311
0.31%
Ranking of countries by current statistics by years


Comments: