29
/
en
AIzaSyAYiBZKx7MnpbEhh9jyipgxe19OcubqV5w
April 1, 2024
219175
Panama
PAN
true
2
1
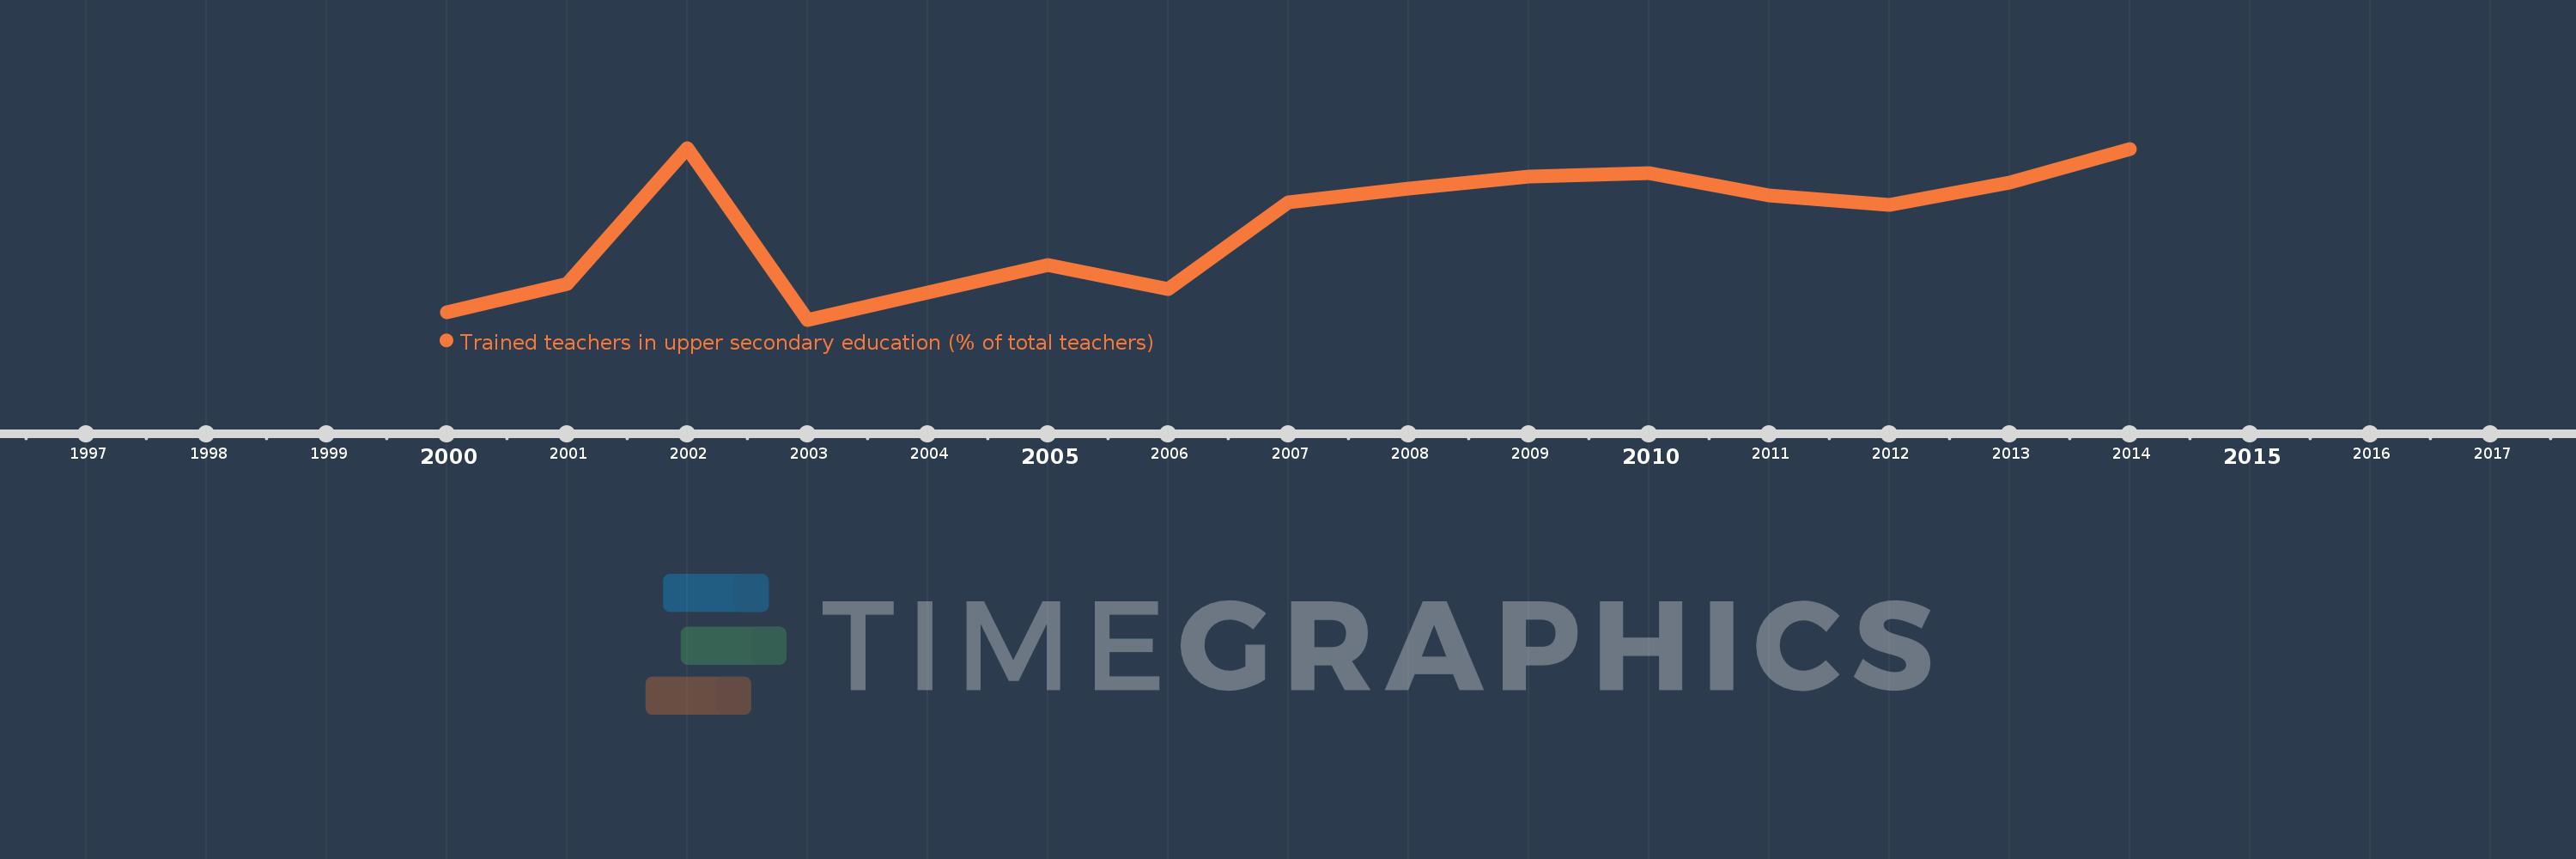
Trained teachers in upper secondary education (% of total teachers)
2014,2013,2012,2011,2010,2009,2008,2007,2006,2005,2003,2002,2001,2000
This statistics in other country:
Timeline:
This timeline shows a graph from 2000 to 2014 of Panama. No data until 1999. Number of actual observations by date: 14.
Source name:
World Development Indicators
Source organization:
United Nations Educational, Scientific, and Cultural Organization (UNESCO) Institute for Statistics.
Categories, topics:
Education
Last updated:
apr 23, 2017
Indicators value changes by year
Maximum:
94.482
jan 1, 2002
At the date of observation
Value
Absolute change
Change from previous value
jan 1, 2000
81.824
+81.824
0.0%
jan 1, 2001
84.06
+2.236
2.73%
jan 1, 2002
94.482
+10.422
12.4%
jan 1, 2003
81.28
-13.202
-13.97%
jan 1, 2005
85.458
+4.178
5.14%
jan 1, 2006
83.61
-1.848
-2.16%
jan 1, 2007
90.275
+6.665
7.97%
jan 1, 2008
91.386
+1.111
1.23%
jan 1, 2009
92.261
+0.875
0.96%
jan 1, 2010
92.552
+0.291
0.32%
jan 1, 2011
90.864
-1.687
-1.82%
jan 1, 2012
90.118
-0.746
-0.82%
jan 1, 2013
91.812
+1.694
1.88%
jan 1, 2014
94.411
+2.599
2.83%
Ranking of countries by current statistics by years


Comments: