29
/
en
AIzaSyAYiBZKx7MnpbEhh9jyipgxe19OcubqV5w
April 1, 2024
39623
IDA only
IDX
false
2
1
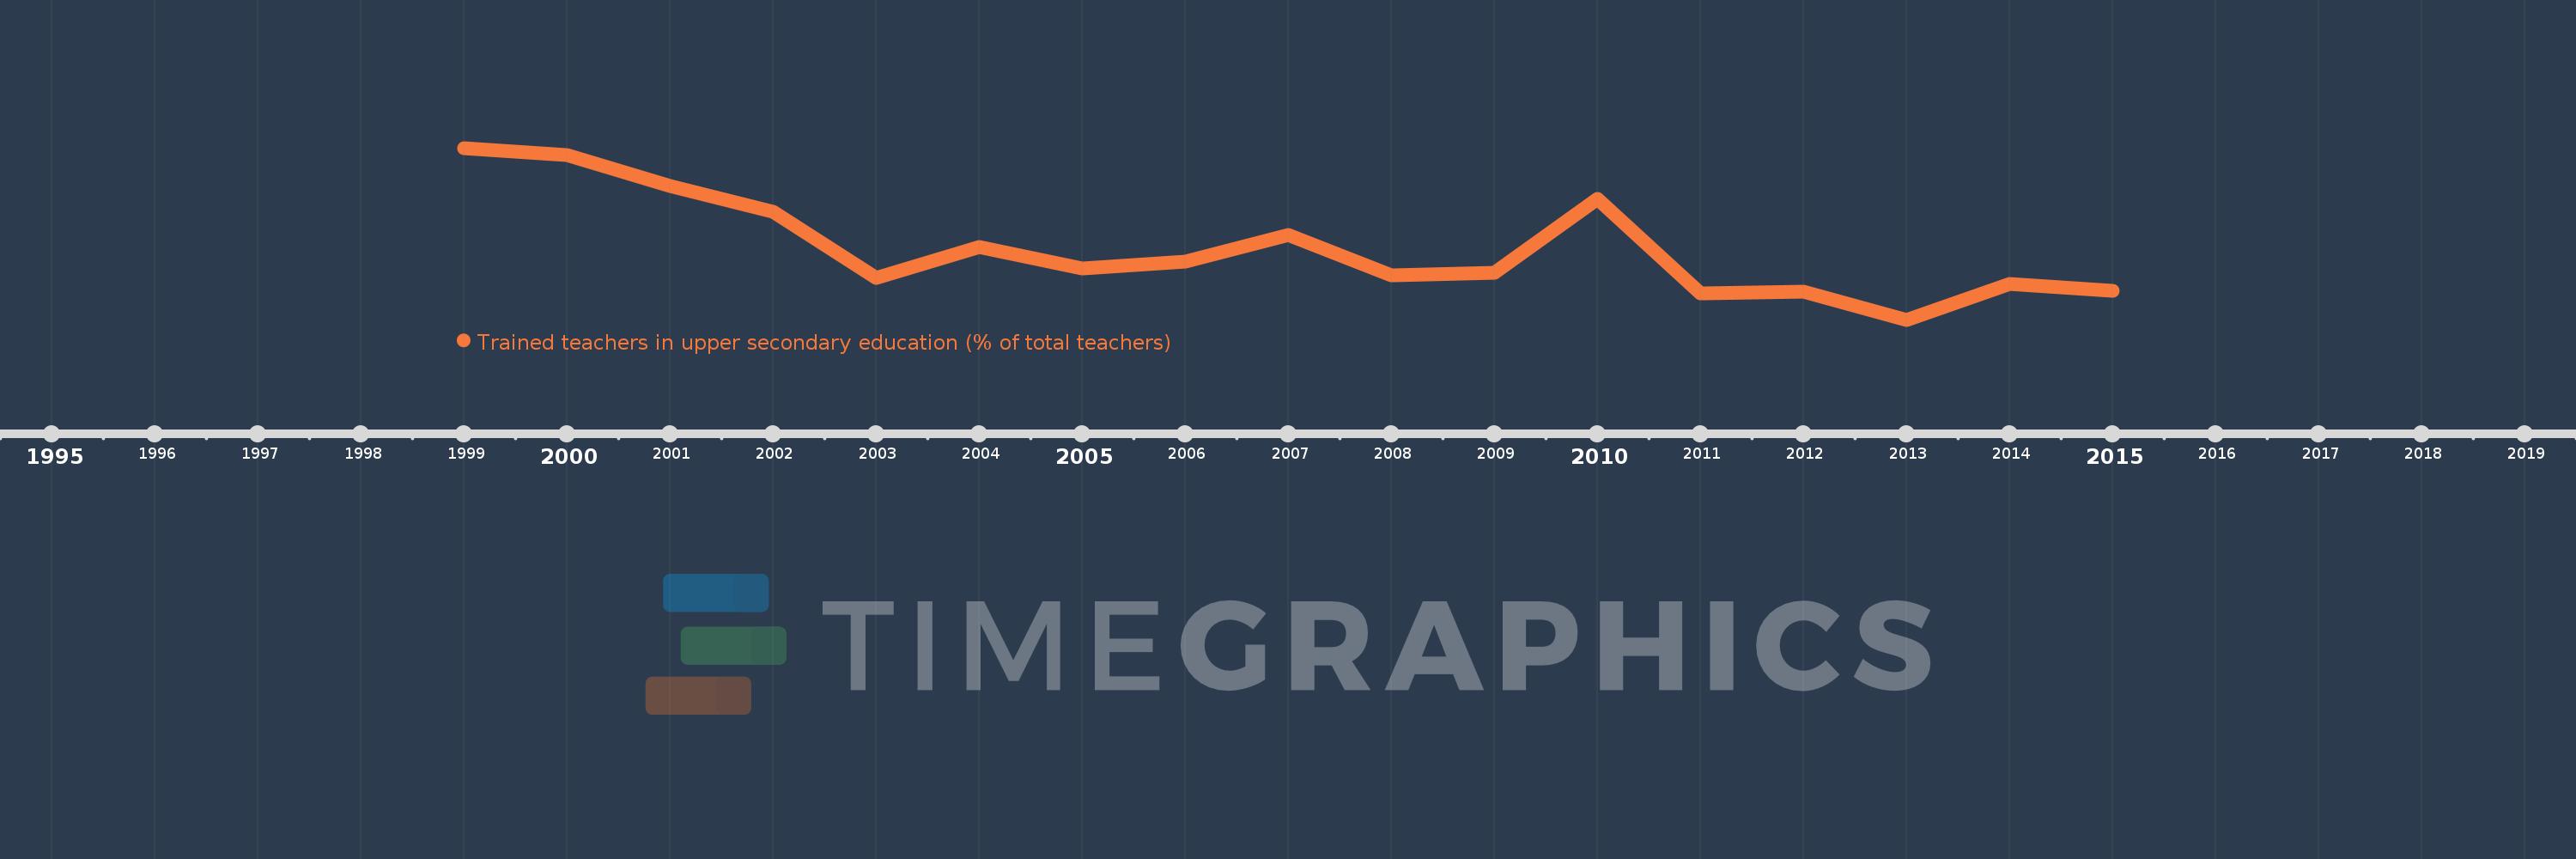
Trained teachers in upper secondary education (% of total teachers)
2015,2014,2013,2012,2011,2010,2009,2008,2007,2006,2005,2004,2003,2002,2001,2000,1999
This statistics in other country:
Timeline:
This timeline shows a graph from 1999 to 2015 of IDA only. No data until 1998. Number of actual observations by date: 17.
Source name:
World Development Indicators
Source organization:
United Nations Educational, Scientific, and Cultural Organization (UNESCO) Institute for Statistics.
Categories, topics:
Education
Last updated:
apr 23, 2017
Indicators value changes by year
Minimum:
51.498
jan 1, 2013
Maximum:
63.178
jan 1, 1999
At the date of observation
Value
Absolute change
Change from previous value
jan 1, 1999
63.178
+63.178
0.0%
jan 1, 2000
62.684
-0.494
-0.78%
jan 1, 2001
60.567
-2.117
-3.38%
jan 1, 2002
58.848
-1.719
-2.84%
jan 1, 2003
54.338
-4.51
-7.66%
jan 1, 2004
56.427
+2.089
3.84%
jan 1, 2005
54.979
-1.448
-2.57%
jan 1, 2006
55.443
+0.464
0.84%
jan 1, 2007
57.265
+1.822
3.29%
jan 1, 2008
54.501
-2.763
-4.83%
jan 1, 2009
54.693
+0.192
0.35%
jan 1, 2010
59.713
+5.02
9.18%
jan 1, 2011
53.289
-6.425
-10.76%
jan 1, 2012
53.389
+0.1
0.19%
jan 1, 2013
51.498
-1.891
-3.54%
jan 1, 2014
53.926
+2.428
4.71%
jan 1, 2015
53.469
-0.457
-0.85%
Ranking of countries by current statistics by years


Comments: