29
/
en
AIzaSyAYiBZKx7MnpbEhh9jyipgxe19OcubqV5w
April 1, 2024
113097
Costa Rica
CRI
true
2
1
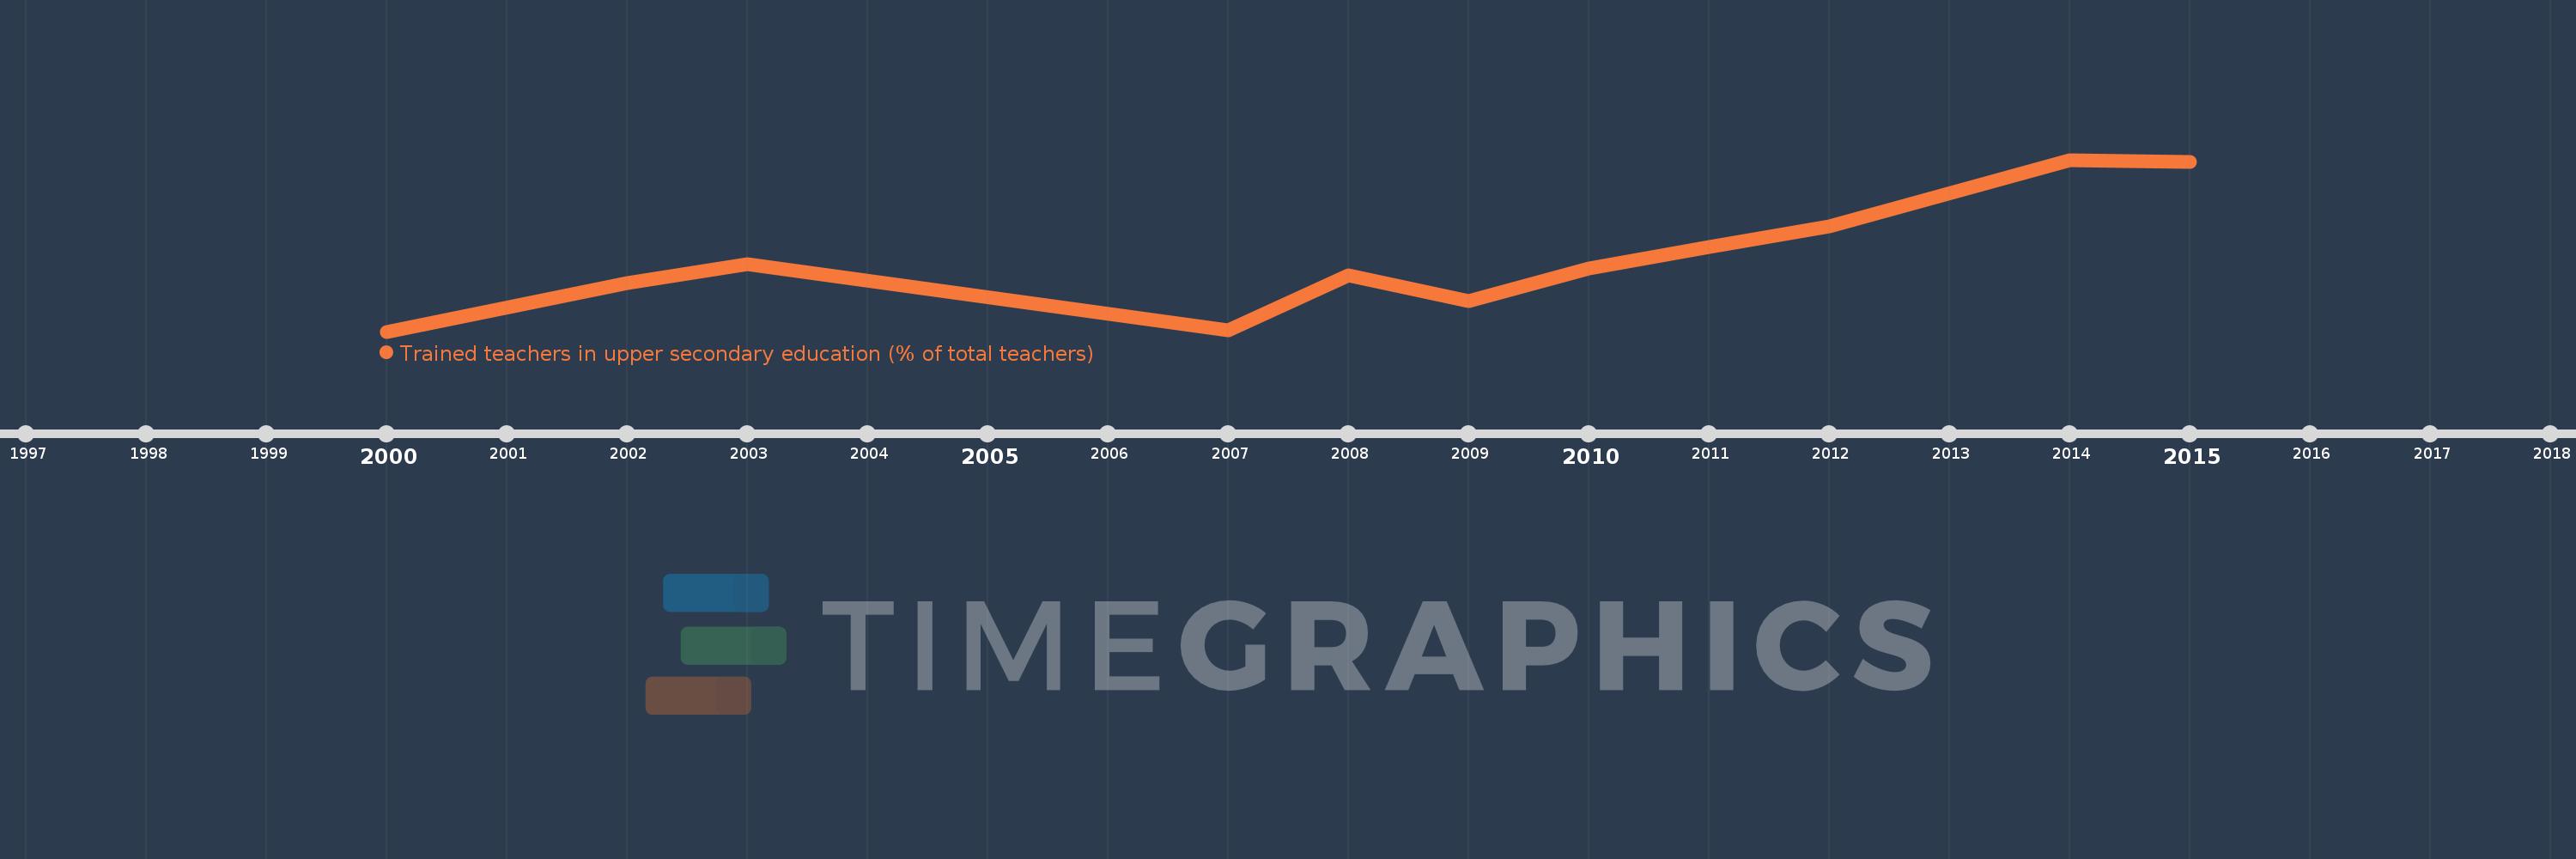
Trained teachers in upper secondary education (% of total teachers)
2015,2014,2012,2011,2010,2009,2008,2007,2003,2002,2000
This statistics in other country:
Timeline:
This timeline shows a graph from 2000 to 2015 of Costa Rica. No data until 1999. Number of actual observations by date: 11.
Source name:
World Development Indicators
Source organization:
United Nations Educational, Scientific, and Cultural Organization (UNESCO) Institute for Statistics.
Categories, topics:
Education
Last updated:
apr 23, 2017
Indicators value changes by year
Minimum:
80.355
jan 1, 2000
Maximum:
95.292
jan 1, 2014
At the date of observation
Value
Absolute change
Change from previous value
jan 1, 2000
80.355
+80.355
0.0%
jan 1, 2002
84.597
+4.242
5.28%
jan 1, 2003
86.199
+1.602
1.89%
jan 1, 2007
80.438
-5.761
-6.68%
jan 1, 2008
85.273
+4.835
6.01%
jan 1, 2009
82.984
-2.289
-2.68%
jan 1, 2010
85.85
+2.866
3.45%
jan 1, 2011
87.726
+1.876
2.19%
jan 1, 2012
89.522
+1.796
2.05%
jan 1, 2014
95.292
+5.77
6.45%
jan 1, 2015
95.072
-0.221
-0.23%
Ranking of countries by current statistics by years


Comments: