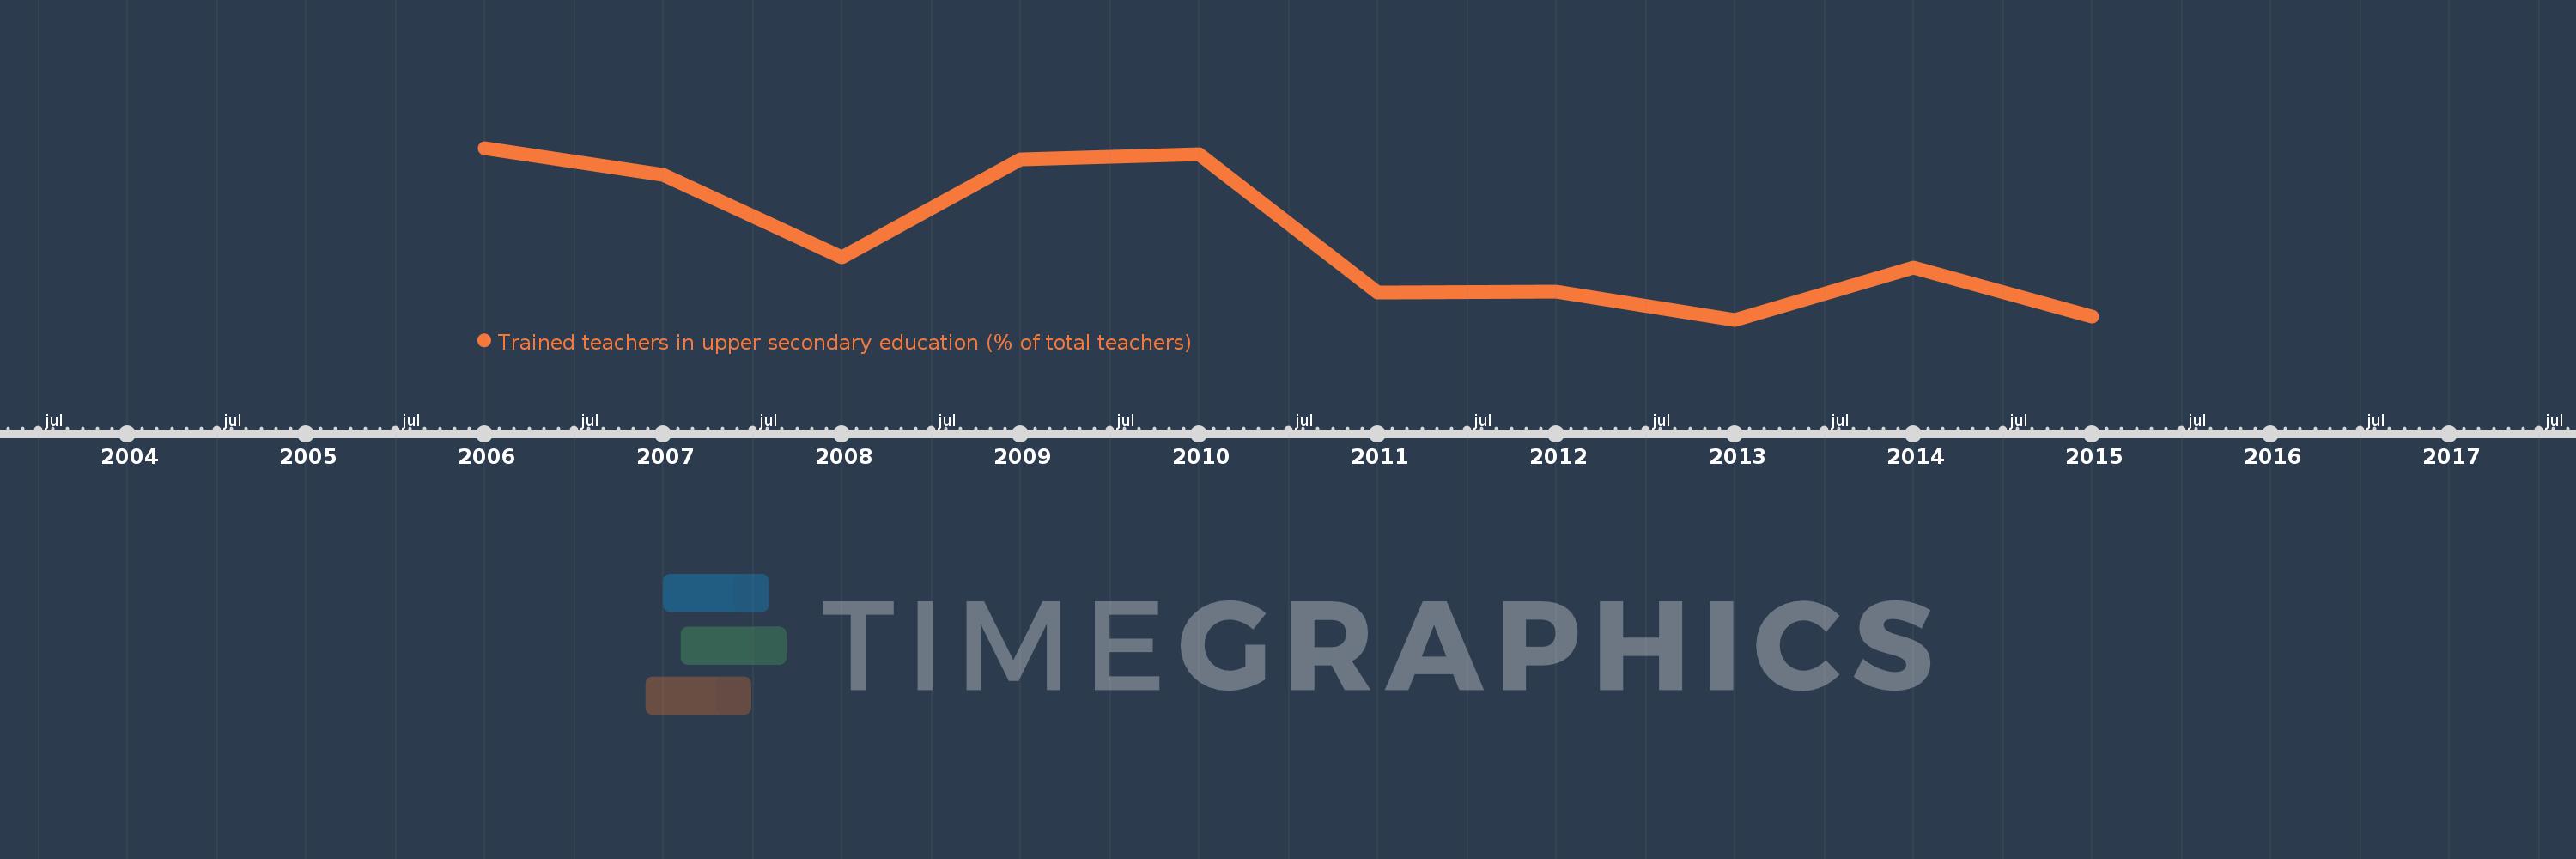
Questa scala temporale mostra un grafico dal 2006 anno al 2015 anno. IDA total. I dati fino ad 2005 anno non disponibili. Il numero di osservazioni attuali secondo i date: 10.
La fonte (nome):
Indicatori dello sviluppo mondiale
La fonte (organizzazione):
United Nations Educational, Scientific, and Cultural Organization (UNESCO) Institute for Statistics.
Categorie:
Education
sono stati aggiornati
23 apr 2017 anni
Indicatori delle variazioni dei valori per anni
In media:
63.158
Minima:
58.801
1 gen 2013 anni
Massimo:
67.982
1 gen 2006 anni
Alla data di osservazione
Valore
Variazione assoluta
La variazione rispetto al valore precedente
1 gen 2006 anni
67.982
+67.982
0.0%
1 gen 2007 anni
66.538
-1.444
-2.12%
1 gen 2008 anni
62.157
-4.381
-6.58%
1 gen 2009 anni
67.372
+5.215
8.39%
1 gen 2010 anni
67.625
+0.253
0.37%
1 gen 2011 anni
60.246
-7.379
-10.91%
1 gen 2012 anni
60.302
+0.056
0.09%
1 gen 2013 anni
58.801
-1.501
-2.49%
1 gen 2014 anni
61.604
+2.803
4.77%
1 gen 2015 anni
58.954
-2.65
-4.3%
Classificazione dei paesi secondo i statistiche attuali per anni
