29
/
en
AIzaSyAYiBZKx7MnpbEhh9jyipgxe19OcubqV5w
April 1, 2024
36147
High income
HIC
false
2
1
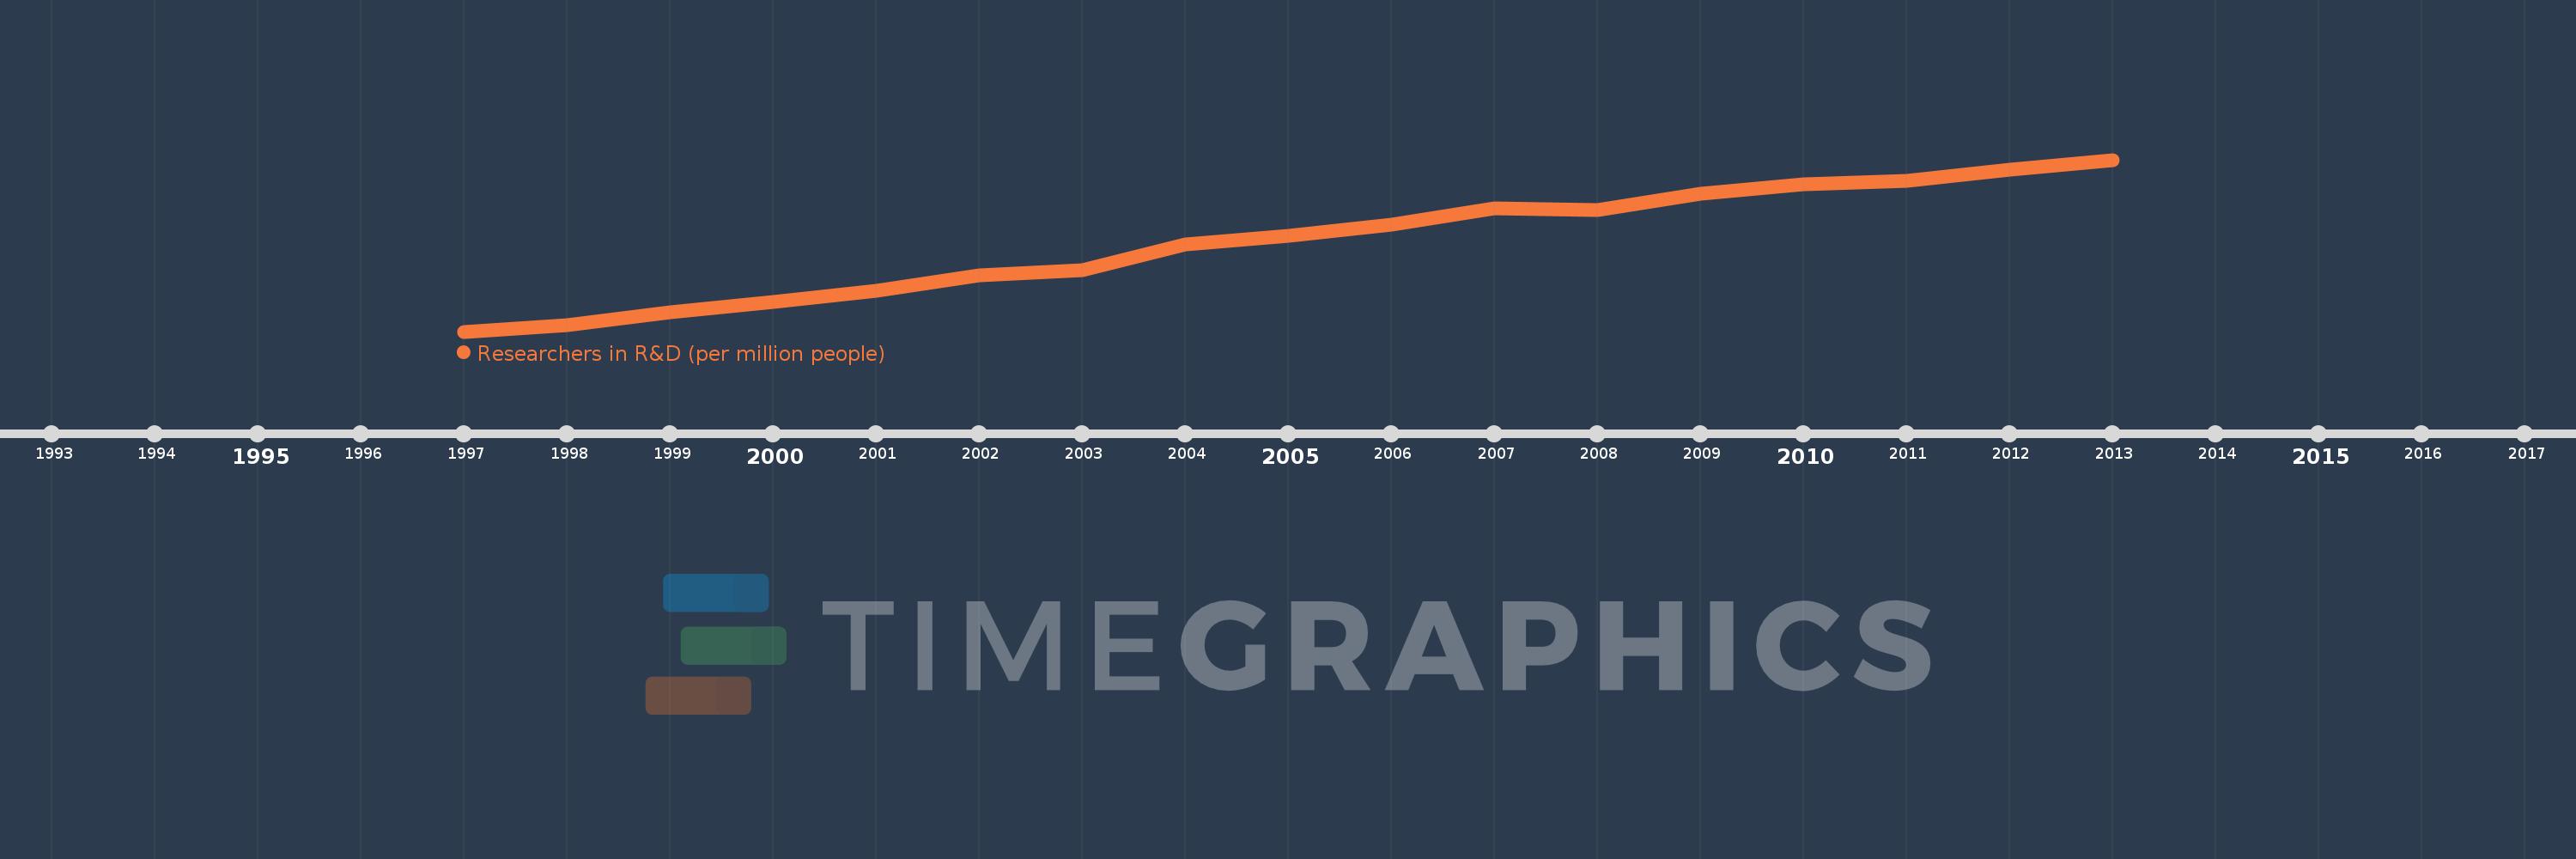
Researchers in R&D (per million people)
2013,2012,2011,2010,2009,2008,2007,2006,2005,2004,2003,2002,2001,2000,1999,1998,1997
This statistics in other country:
Timeline:
This timeline shows a graph from 1997 to 2013 of High income. No data until 1996. Number of actual observations by date: 17.
Source name:
World Development Indicators
Source organization:
United Nations Educational, Scientific, and Cultural Organization (UNESCO) Institute for Statistics.
Categories, topics:
Science & Technology
Last updated:
apr 23, 2017
Indicators value changes by year
Minimum:
2.853K
jan 1, 1997
Maximum:
3.975K
jan 1, 2013
At the date of observation
Value
Absolute change
Change from previous value
jan 1, 1997
2.853K
+2.853K
0.0%
jan 1, 1998
2.894K
+40.076
1.4%
jan 1, 1999
2.978K
+83.984
2.9%
jan 1, 2000
3.046K
+68.401
2.3%
jan 1, 2001
3.118K
+72.42
2.38%
jan 1, 2002
3.22K
+101.795
3.26%
jan 1, 2003
3.256K
+36.323
1.13%
jan 1, 2004
3.421K
+164.613
5.05%
jan 1, 2005
3.479K
+58.416
1.71%
jan 1, 2006
3.552K
+72.429
2.08%
jan 1, 2007
3.659K
+106.591
3.0%
jan 1, 2008
3.645K
-13.157
-0.36%
jan 1, 2009
3.753K
+107.279
2.94%
jan 1, 2010
3.815K
+62.024
1.65%
jan 1, 2011
3.836K
+21.026
0.55%
jan 1, 2012
3.911K
+75.815
1.98%
jan 1, 2013
3.975K
+63.143
1.61%
Ranking of countries by current statistics by years


Comments: