29
/
en
AIzaSyAYiBZKx7MnpbEhh9jyipgxe19OcubqV5w
April 1, 2024
52212
North America
NAC
false
2
1
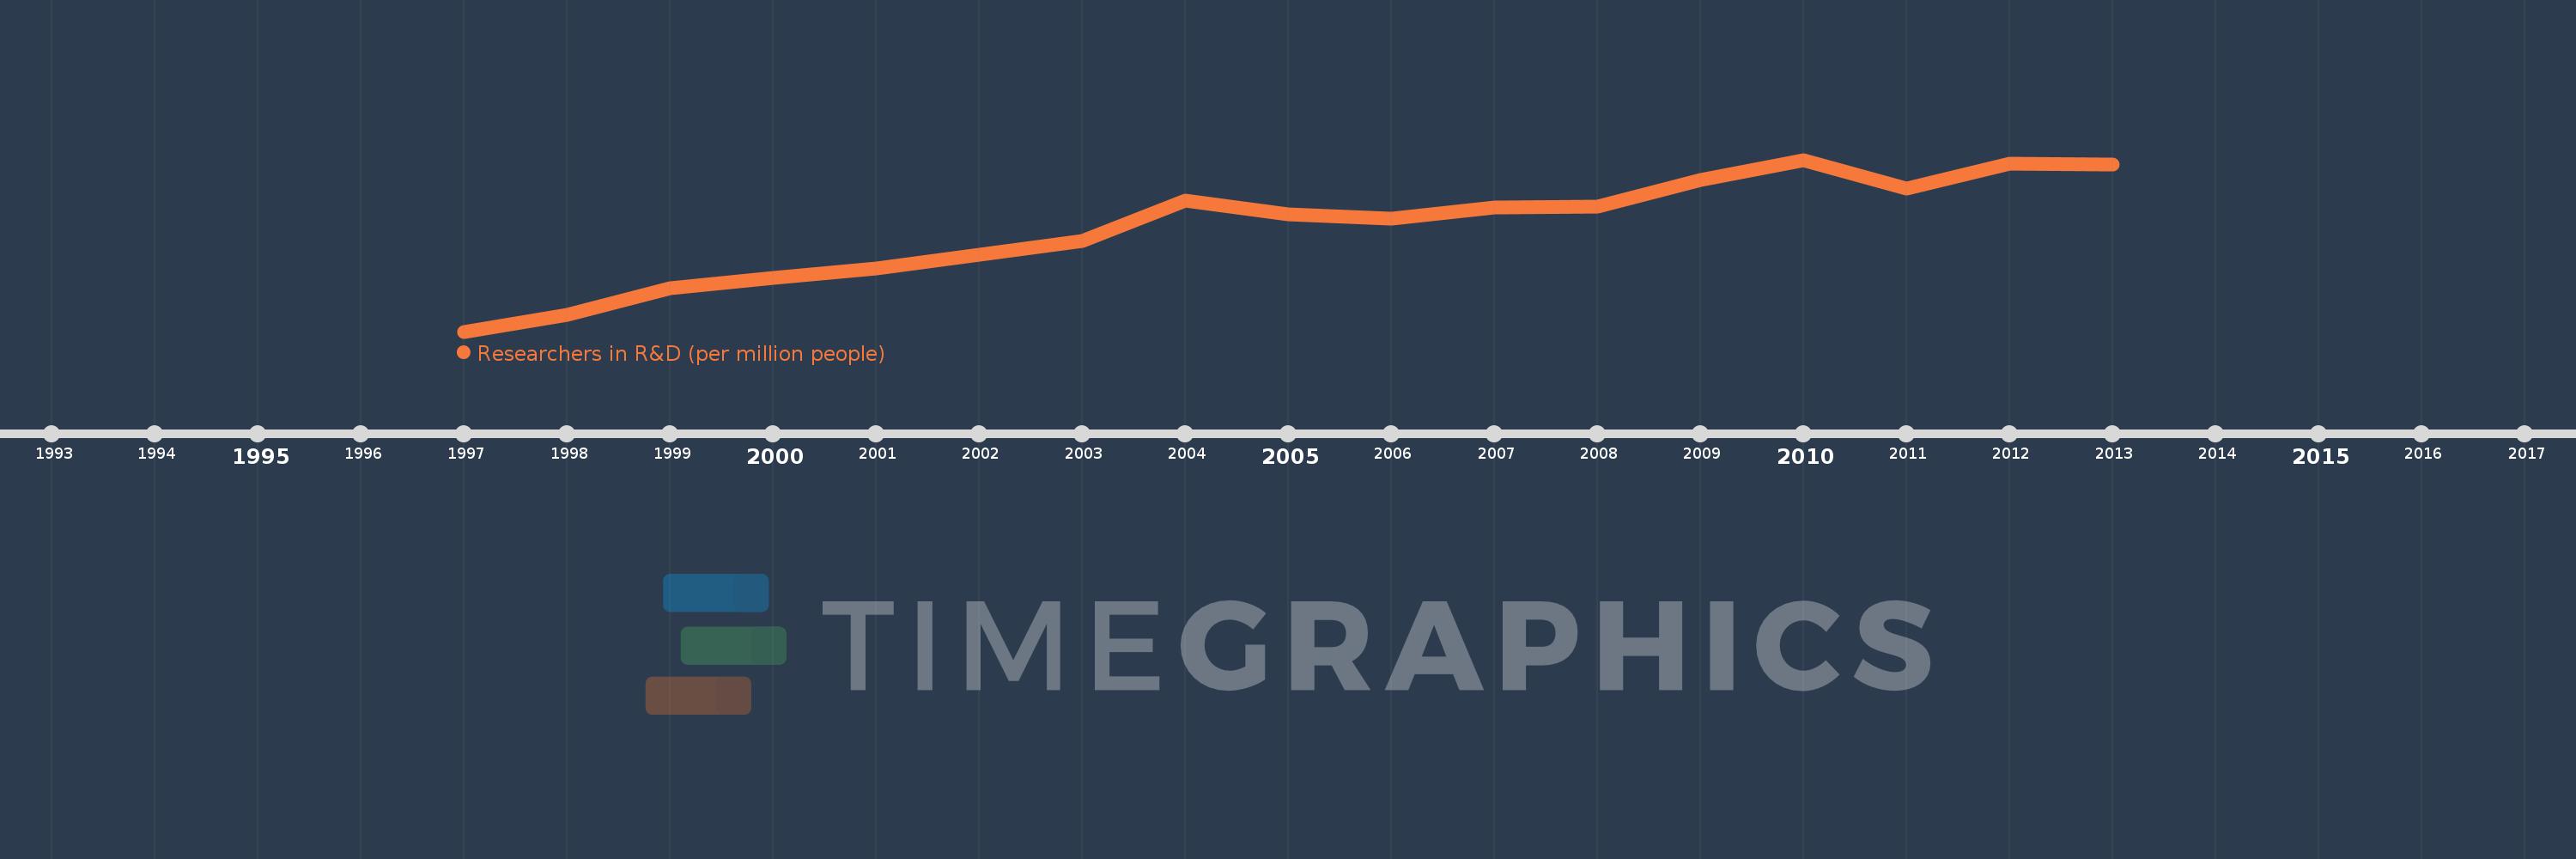
Researchers in R&D (per million people)
2013,2012,2011,2010,2009,2008,2007,2006,2005,2004,2003,2002,2001,2000,1999,1998,1997
This statistics in other country:
Timeline:
This timeline shows a graph from 1997 to 2013 of North America. No data until 1996. Number of actual observations by date: 17.
Source name:
World Development Indicators
Source organization:
United Nations Educational, Scientific, and Cultural Organization (UNESCO) Institute for Statistics.
Categories, topics:
Science & Technology
Last updated:
apr 23, 2017
Indicators value changes by year
Minimum:
3.116K
jan 1, 1997
Maximum:
4.109K
jan 1, 2010
At the date of observation
Value
Absolute change
Change from previous value
jan 1, 1997
3.116K
+3.116K
0.0%
jan 1, 1998
3.214K
+97.674
3.13%
jan 1, 1999
3.365K
+151.648
4.72%
jan 1, 2000
3.425K
+59.845
1.78%
jan 1, 2001
3.479K
+54.167
1.58%
jan 1, 2002
3.56K
+80.902
2.33%
jan 1, 2003
3.638K
+77.533
2.18%
jan 1, 2004
3.873K
+235.372
6.47%
jan 1, 2005
3.796K
-76.795
-1.98%
jan 1, 2006
3.769K
-27.064
-0.71%
jan 1, 2007
3.834K
+64.661
1.72%
jan 1, 2008
3.84K
+5.573
0.15%
jan 1, 2009
3.991K
+151.074
3.93%
jan 1, 2010
4.109K
+118.695
2.97%
jan 1, 2011
3.944K
-164.856
-4.01%
jan 1, 2012
4.088K
+143.283
3.63%
jan 1, 2013
4.08K
-7.754
-0.19%
Ranking of countries by current statistics by years


Comments: