29
/
en
AIzaSyAYiBZKx7MnpbEhh9jyipgxe19OcubqV5w
April 1, 2024
145055
Guatemala
GTM
true
2
1
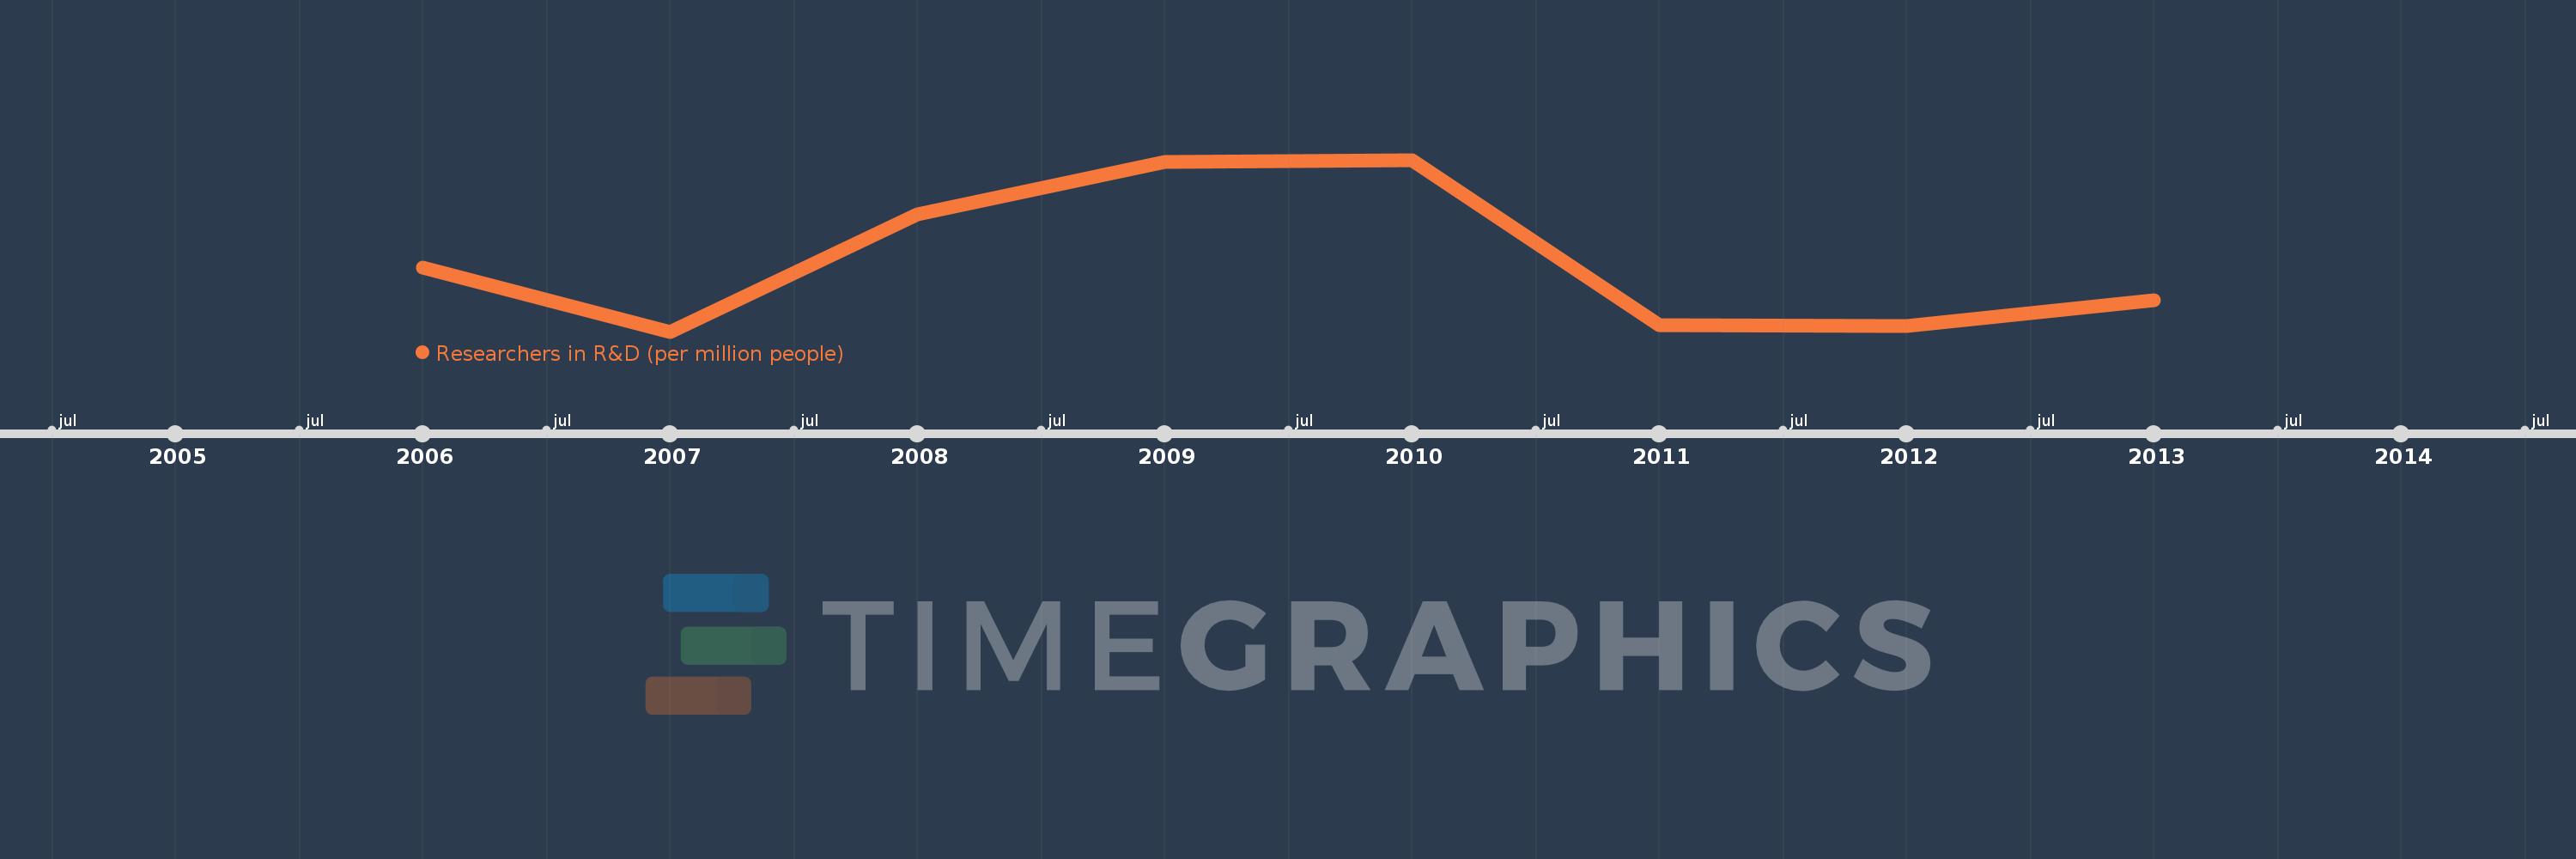
Researchers in R&D (per million people)
2013,2012,2011,2010,2009,2008,2007,2006
This statistics in other country:
Timeline:
This timeline shows a graph from 2006 to 2013 of Guatemala. No data until 2005. Number of actual observations by date: 8.
Source name:
World Development Indicators
Source organization:
United Nations Educational, Scientific, and Cultural Organization (UNESCO) Institute for Statistics.
Categories, topics:
Science & Technology
Last updated:
apr 23, 2017
Indicators value changes by year
Minimum:
24.092
jan 1, 2007
Maximum:
38.424
jan 1, 2010
At the date of observation
Value
Absolute change
Change from previous value
jan 1, 2006
29.431
+29.431
0.0%
jan 1, 2007
24.092
-5.339
-18.14%
jan 1, 2008
33.846
+9.755
40.49%
jan 1, 2009
38.28
+4.433
13.1%
jan 1, 2010
38.424
+0.144
0.38%
jan 1, 2011
24.64
-13.784
-35.87%
jan 1, 2012
24.586
-0.054
-0.22%
jan 1, 2013
26.743
+2.157
8.77%
Ranking of countries by current statistics by years


Comments: