29
/
en
AIzaSyAYiBZKx7MnpbEhh9jyipgxe19OcubqV5w
April 1, 2024
33826
European Union
EUU
false
2
1
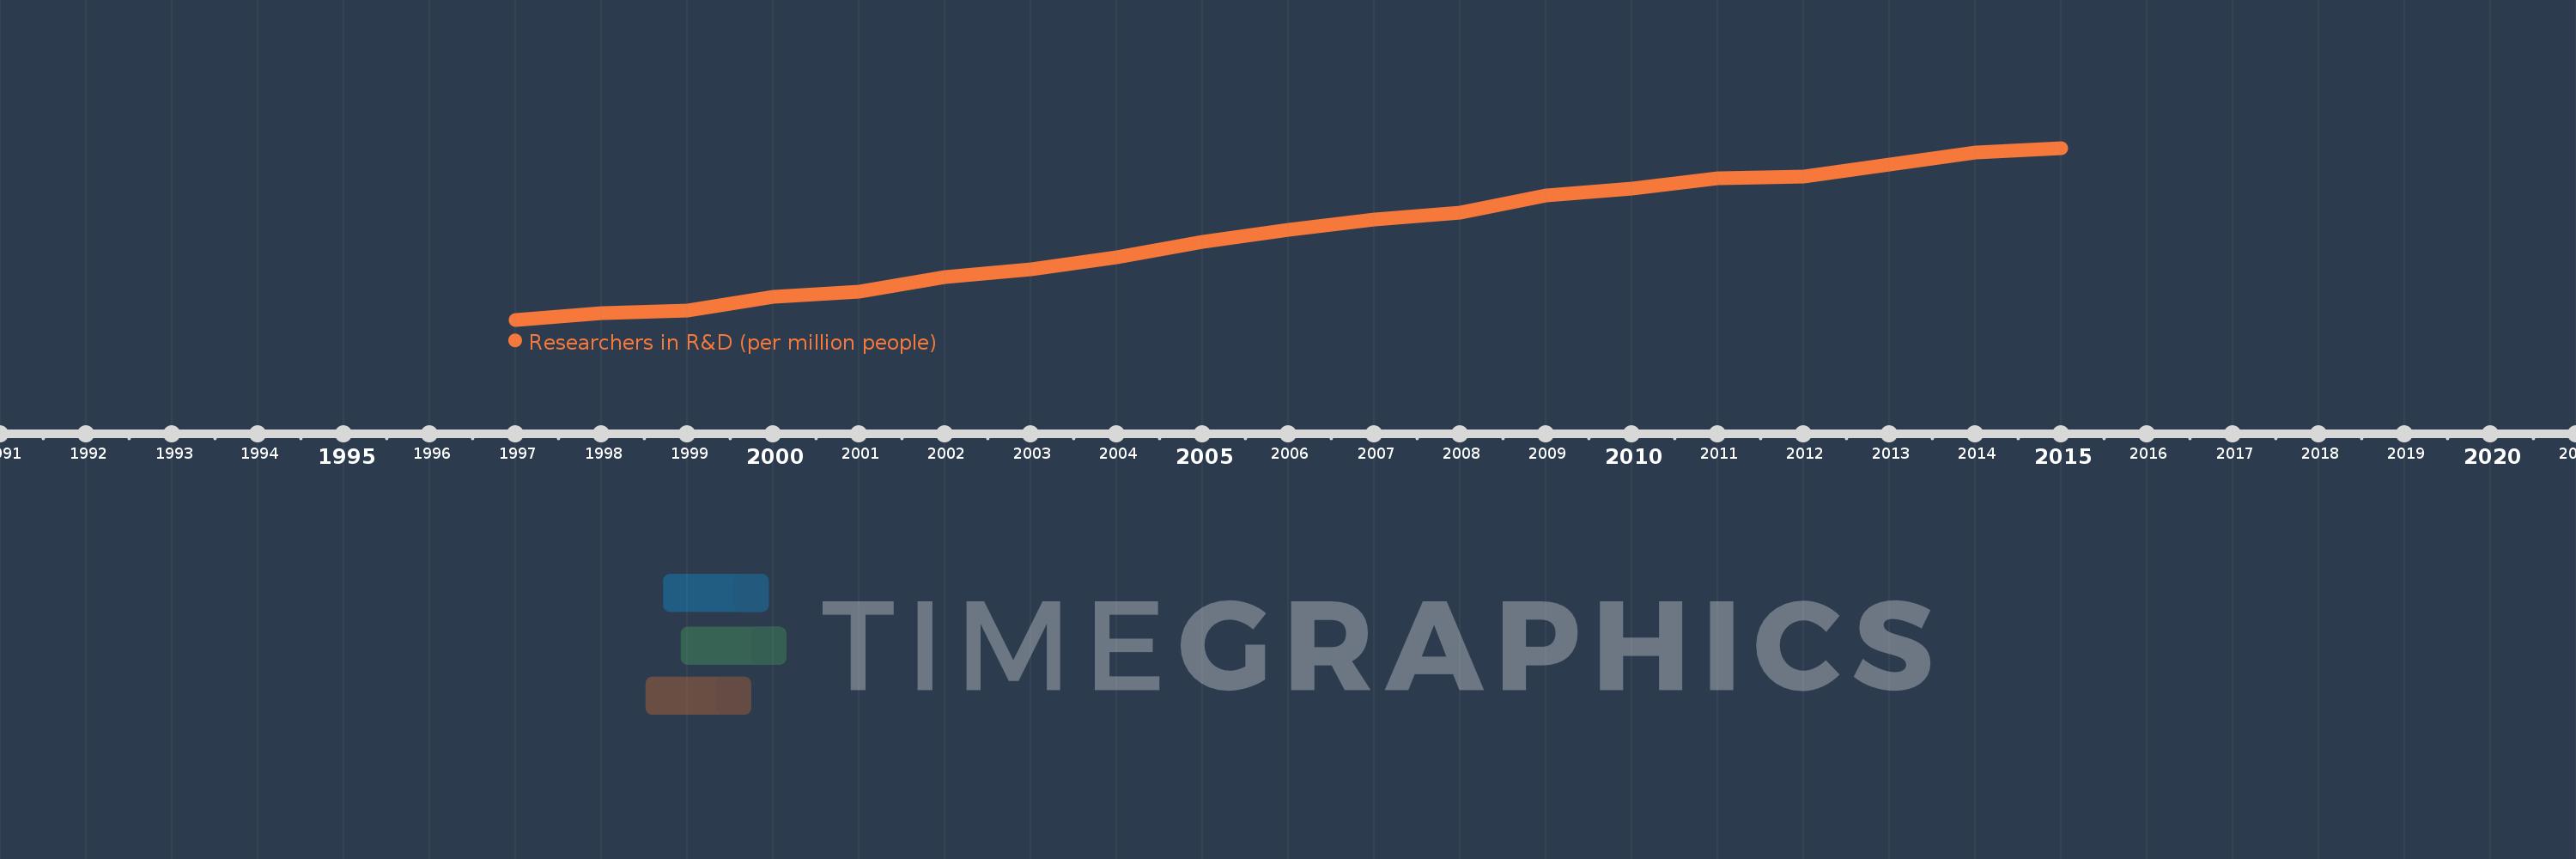
Researchers in R&D (per million people)
2015,2014,2013,2012,2011,2010,2009,2008,2007,2006,2005,2004,2003,2002,2001,2000,1999,1998,1997
This statistics in other country:
Timeline:
This timeline shows a graph from 1997 to 2015 of European Union. No data until 1996. Number of actual observations by date: 19.
Source name:
World Development Indicators
Source organization:
United Nations Educational, Scientific, and Cultural Organization (UNESCO) Institute for Statistics.
Categories, topics:
Science & Technology
Last updated:
apr 23, 2017
Indicators value changes by year
Minimum:
2.031K
jan 1, 1997
Maximum:
3.481K
jan 1, 2015
At the date of observation
Value
Absolute change
Change from previous value
jan 1, 1997
2.031K
+2.031K
0.0%
jan 1, 1998
2.085K
+54.057
2.66%
jan 1, 1999
2.11K
+24.753
1.19%
jan 1, 2000
2.226K
+116.655
5.53%
jan 1, 2001
2.269K
+42.832
1.92%
jan 1, 2002
2.389K
+119.958
5.29%
jan 1, 2003
2.456K
+66.647
2.79%
jan 1, 2004
2.559K
+103.315
4.21%
jan 1, 2005
2.689K
+129.895
5.08%
jan 1, 2006
2.788K
+99.339
3.69%
jan 1, 2007
2.875K
+86.861
3.12%
jan 1, 2008
2.938K
+62.657
2.18%
jan 1, 2009
3.081K
+143.182
4.87%
jan 1, 2010
3.135K
+53.689
1.74%
jan 1, 2011
3.221K
+86.759
2.77%
jan 1, 2012
3.242K
+20.623
0.64%
jan 1, 2013
3.342K
+99.892
3.08%
jan 1, 2014
3.439K
+96.982
2.9%
jan 1, 2015
3.481K
+41.839
1.22%
Ranking of countries by current statistics by years


Comments: