29
/
en
AIzaSyAYiBZKx7MnpbEhh9jyipgxe19OcubqV5w
April 1, 2024
198230
Moldova
MDA
true
2
1
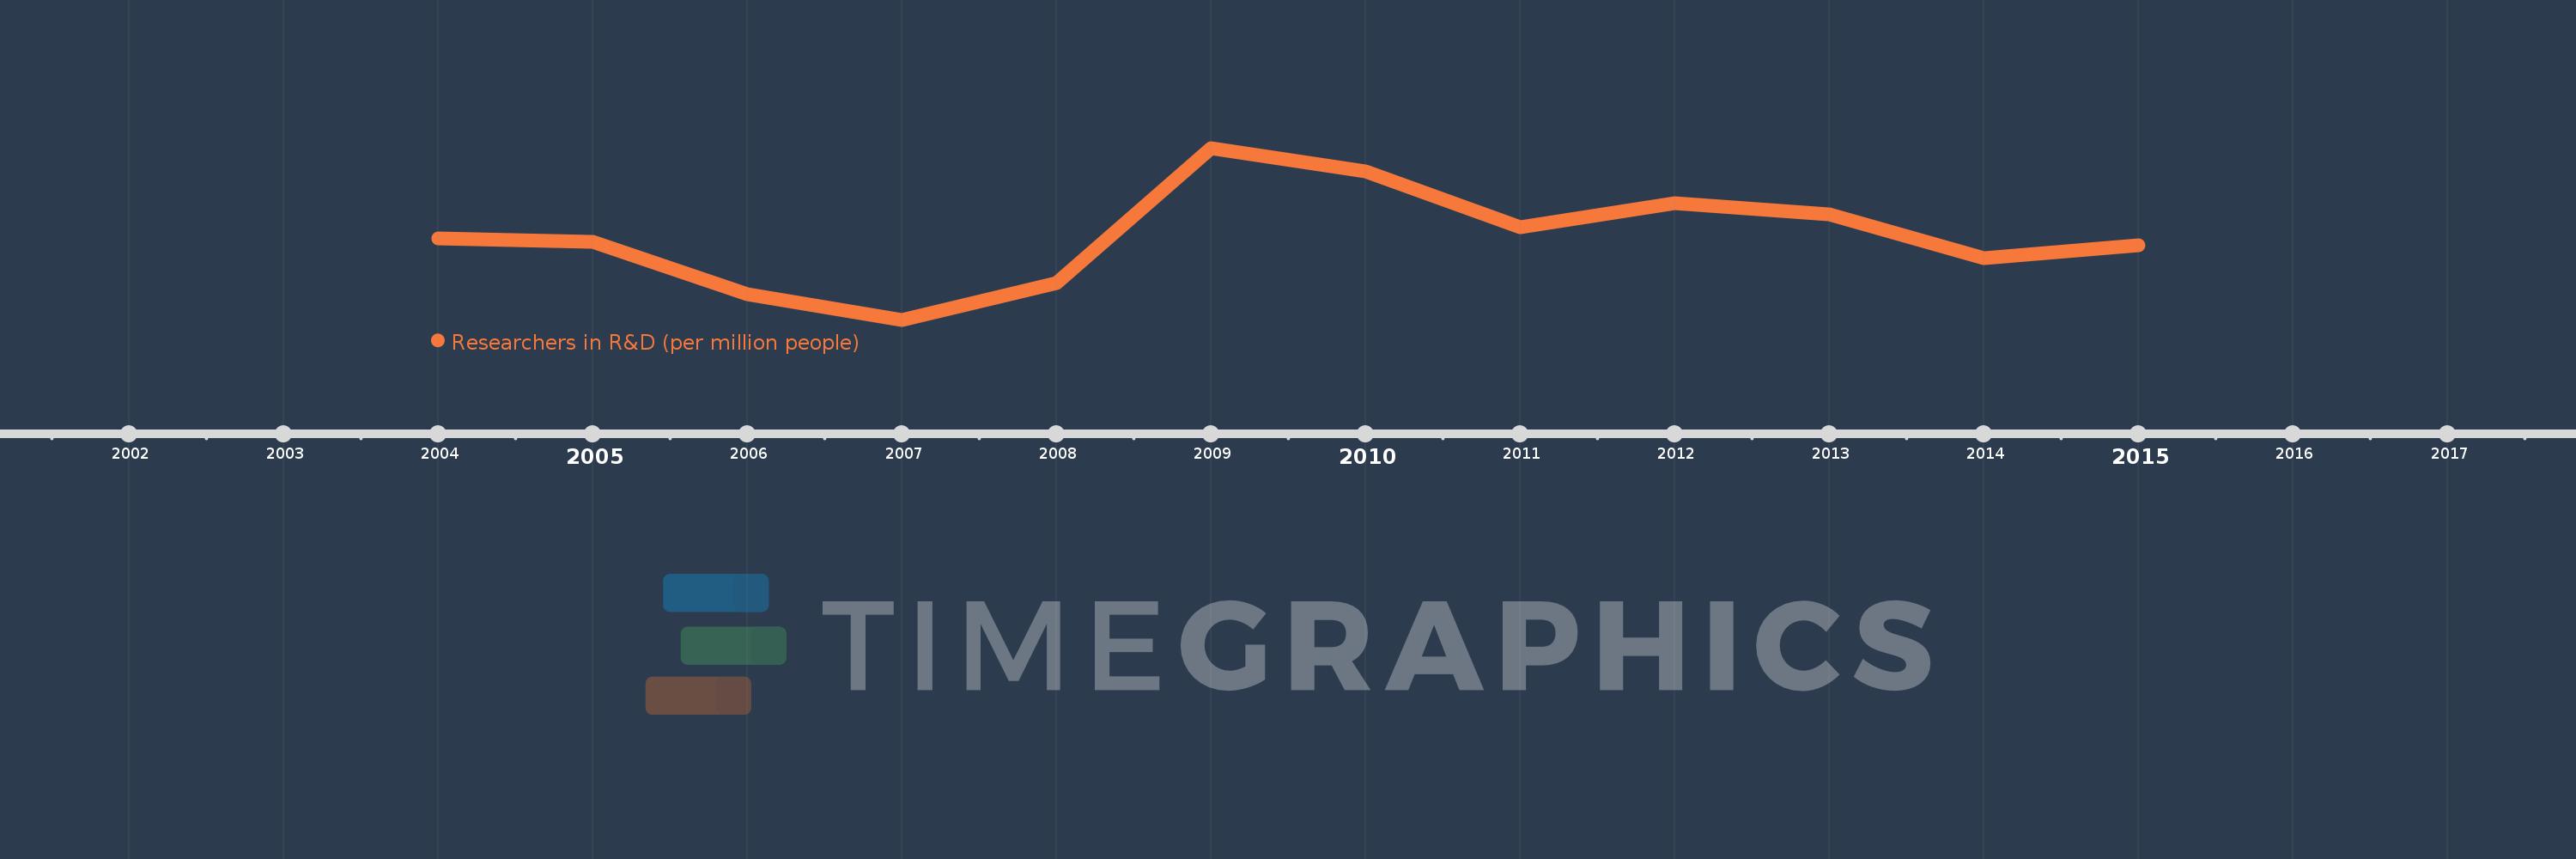
Researchers in R&D (per million people)
2015,2014,2013,2012,2011,2010,2009,2008,2007,2006,2005,2004
This statistics in other country:
Timeline:
This timeline shows a graph from 2004 to 2015 of Moldova. No data until 2003. Number of actual observations by date: 12.
Source name:
World Development Indicators
Source organization:
United Nations Educational, Scientific, and Cultural Organization (UNESCO) Institute for Statistics.
Categories, topics:
Science & Technology
Last updated:
apr 23, 2017
Indicators value changes by year
Minimum:
604.876
jan 1, 2007
Maximum:
713.423
jan 1, 2009
At the date of observation
Value
Absolute change
Change from previous value
jan 1, 2004
656.09
+656.09
0.0%
jan 1, 2005
654.046
-2.043
-0.31%
jan 1, 2006
621.256
-32.79
-5.01%
jan 1, 2007
604.876
-16.38
-2.64%
jan 1, 2008
627.837
+22.961
3.8%
jan 1, 2009
713.423
+85.585
13.63%
jan 1, 2010
698.518
-14.904
-2.09%
jan 1, 2011
663.242
-35.276
-5.05%
jan 1, 2012
678.55
+15.309
2.31%
jan 1, 2013
671.452
-7.099
-1.05%
jan 1, 2014
643.884
-27.567
-4.11%
jan 1, 2015
651.959
+8.075
1.25%
Ranking of countries by current statistics by years


Comments: