29
/
en
AIzaSyAYiBZKx7MnpbEhh9jyipgxe19OcubqV5w
April 1, 2024
268661
Tunisia
TUN
true
2
1
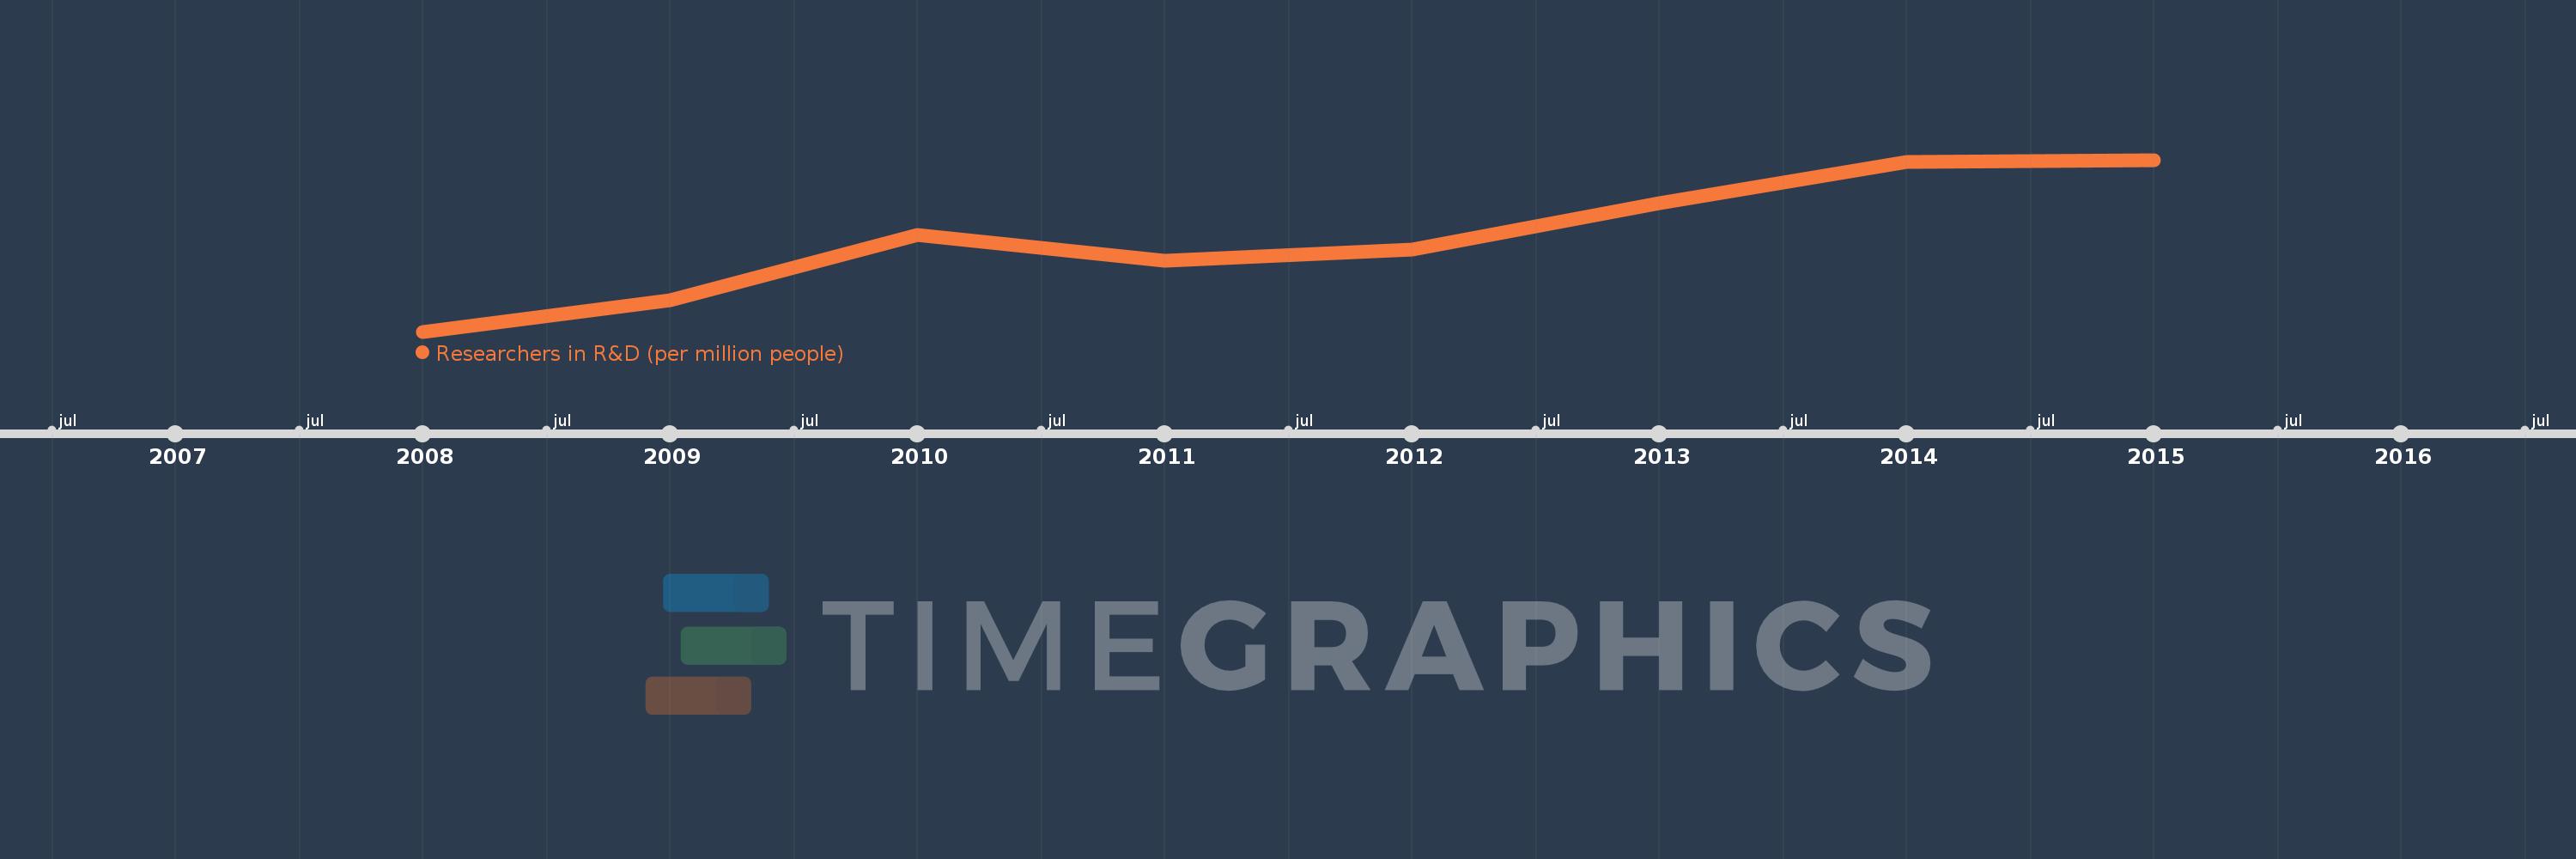
Researchers in R&D (per million people)
2015,2014,2013,2012,2011,2010,2009,2008
This statistics in other country:
Timeline:
This timeline shows a graph from 2008 to 2015 of Tunisia. No data until 2007. Number of actual observations by date: 8.
Source name:
World Development Indicators
Source organization:
United Nations Educational, Scientific, and Cultural Organization (UNESCO) Institute for Statistics.
Categories, topics:
Science & Technology
Last updated:
apr 23, 2017
Indicators value changes by year
Minimum:
1.088K
jan 1, 2008
Maximum:
1.803K
jan 1, 2015
At the date of observation
Value
Absolute change
Change from previous value
jan 1, 2008
1.088K
+1.088K
0.0%
jan 1, 2009
1.218K
+129.702
11.92%
jan 1, 2010
1.491K
+272.849
22.4%
jan 1, 2011
1.384K
-106.815
-7.16%
jan 1, 2012
1.429K
+44.925
3.25%
jan 1, 2013
1.623K
+193.615
13.55%
jan 1, 2014
1.793K
+169.763
10.46%
jan 1, 2015
1.803K
+10.685
0.6%
Ranking of countries by current statistics by years


Comments: