29
/
en
AIzaSyAYiBZKx7MnpbEhh9jyipgxe19OcubqV5w
April 1, 2024
101537
Canada
CAN
true
2
1
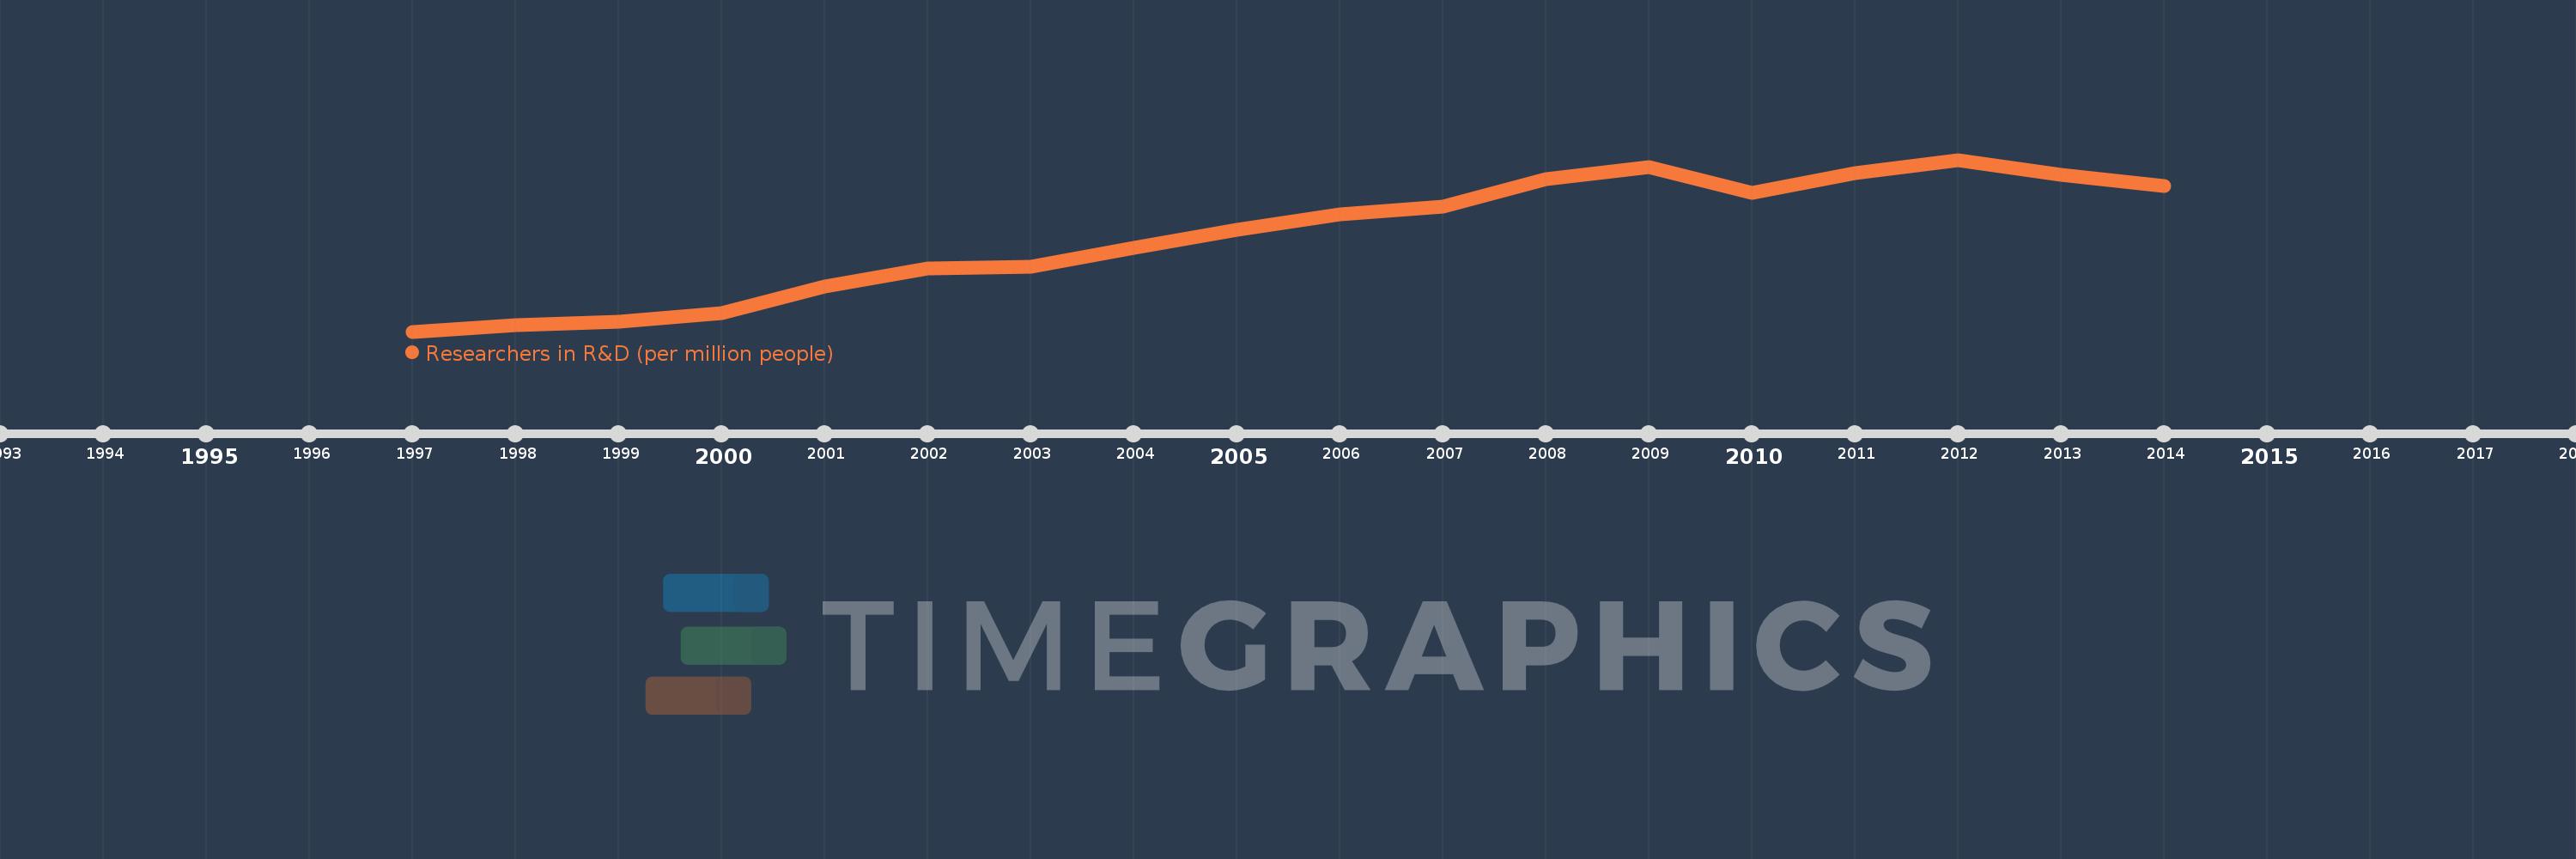
Researchers in R&D (per million people)
2014,2013,2012,2011,2010,2009,2008,2007,2006,2005,2004,2003,2002,2001,2000,1999,1998,1997
This statistics in other country:
Timeline:
This timeline shows a graph from 1997 to 2014 of Canada. No data until 1996. Number of actual observations by date: 18.
Source name:
World Development Indicators
Source organization:
United Nations Educational, Scientific, and Cultural Organization (UNESCO) Institute for Statistics.
Categories, topics:
Science & Technology
Last updated:
apr 23, 2017
Indicators value changes by year
Minimum:
3.058K
jan 1, 1997
Maximum:
4.786K
jan 1, 2012
At the date of observation
Value
Absolute change
Change from previous value
jan 1, 1997
3.058K
+3.058K
0.0%
jan 1, 1998
3.119K
+61.375
2.01%
jan 1, 1999
3.159K
+39.115
1.25%
jan 1, 2000
3.243K
+84.325
2.67%
jan 1, 2001
3.514K
+271.597
8.38%
jan 1, 2002
3.695K
+180.462
5.13%
jan 1, 2003
3.706K
+11.243
0.3%
jan 1, 2004
3.9K
+193.958
5.23%
jan 1, 2005
4.085K
+184.664
4.73%
jan 1, 2006
4.238K
+153.159
3.75%
jan 1, 2007
4.313K
+75.284
1.78%
jan 1, 2008
4.588K
+275.011
6.38%
jan 1, 2009
4.712K
+123.548
2.69%
jan 1, 2010
4.451K
-260.354
-5.53%
jan 1, 2011
4.649K
+197.8
4.44%
jan 1, 2012
4.786K
+136.303
2.93%
jan 1, 2013
4.634K
-151.206
-3.16%
jan 1, 2014
4.519K
-115.801
-2.5%
Ranking of countries by current statistics by years


Comments: