29
/
en
AIzaSyAYiBZKx7MnpbEhh9jyipgxe19OcubqV5w
April 1, 2024
125483
Egypt, Arab Rep.
EGY
true
2
1
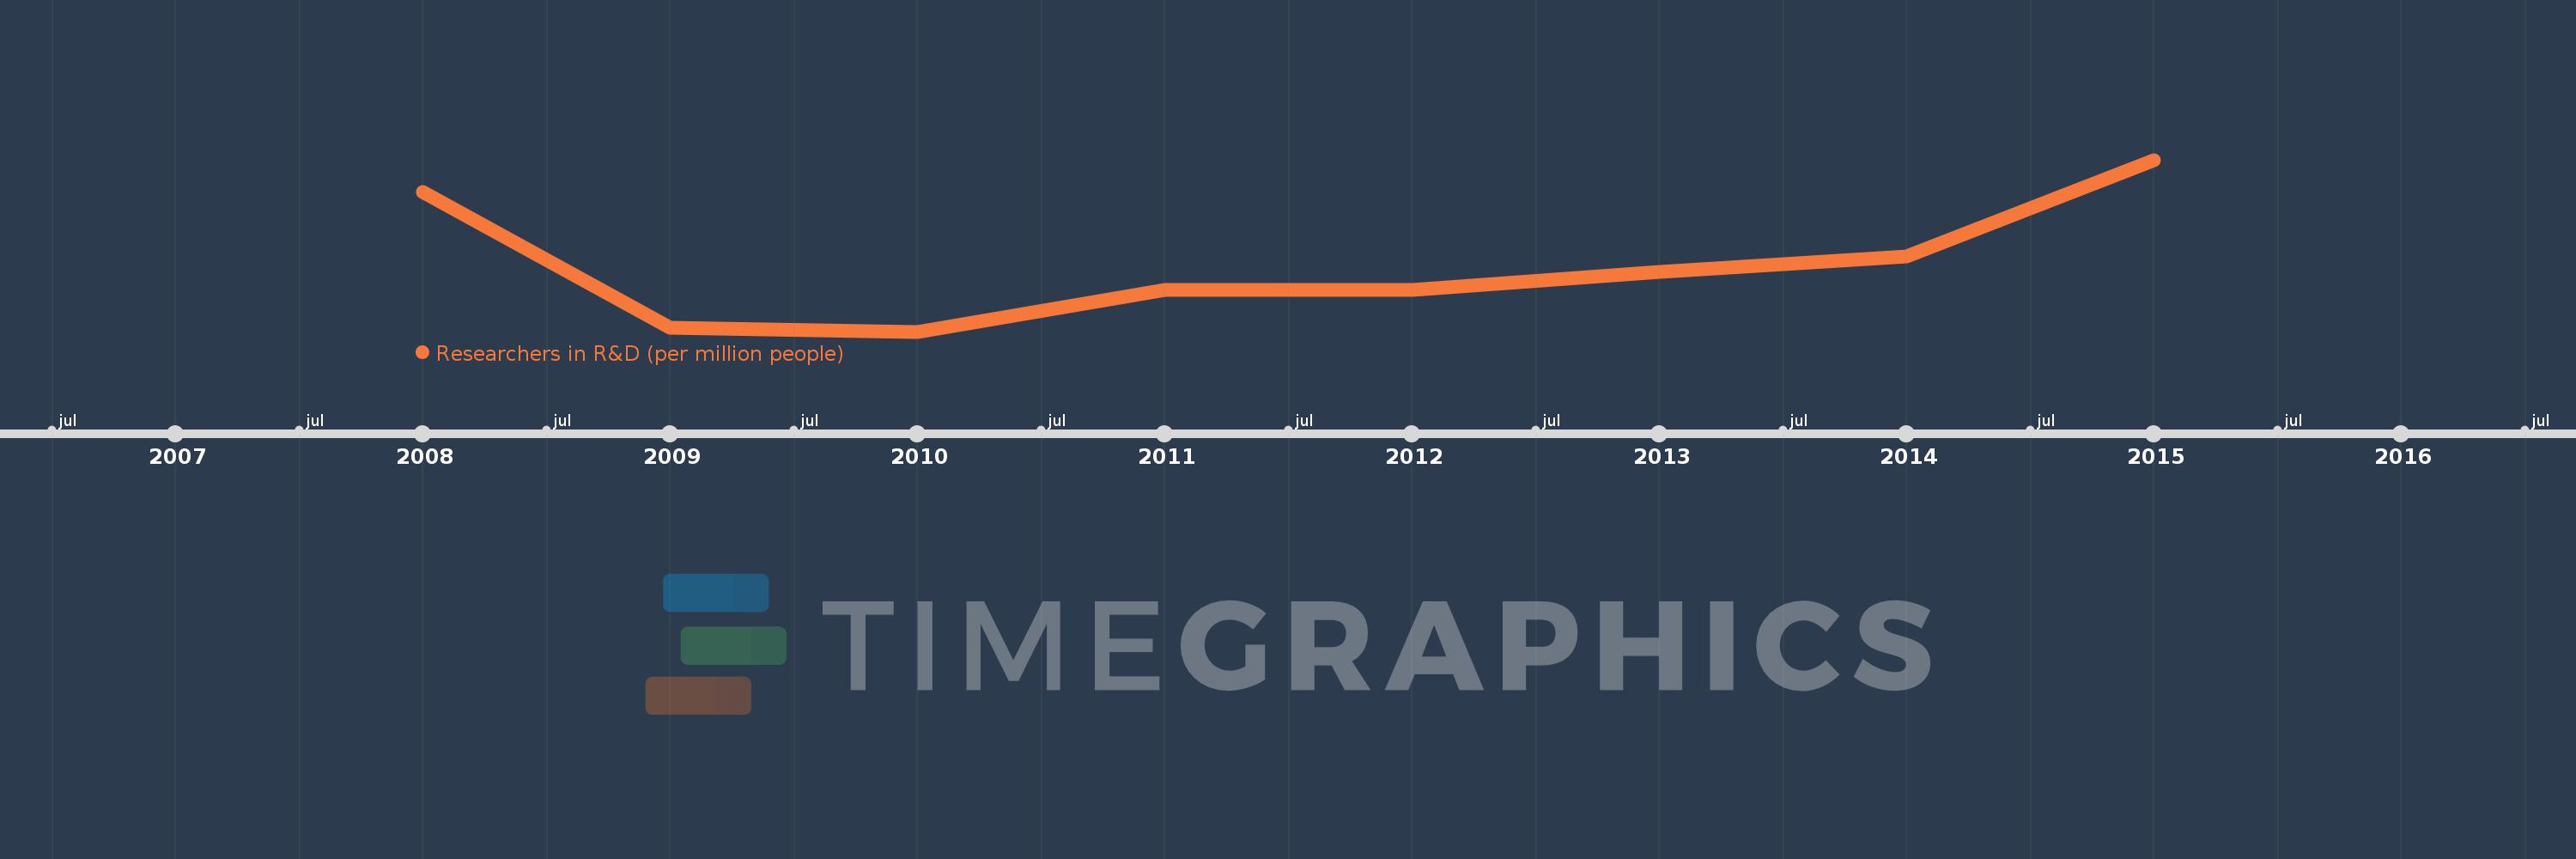
Researchers in R&D (per million people)
2015,2014,2013,2012,2011,2010,2009,2008
This statistics in other country:
Timeline:
This timeline shows a graph from 2008 to 2015 of Egypt, Arab Rep.. No data until 2007. Number of actual observations by date: 8.
Source name:
World Development Indicators
Source organization:
United Nations Educational, Scientific, and Cultural Organization (UNESCO) Institute for Statistics.
Categories, topics:
Science & Technology
Last updated:
apr 23, 2017
Indicators value changes by year
Minimum:
437.058
jan 1, 2010
Maximum:
681.612
jan 1, 2015
At the date of observation
Value
Absolute change
Change from previous value
jan 1, 2008
636.077
+636.077
0.0%
jan 1, 2009
442.269
-193.808
-30.47%
jan 1, 2010
437.058
-5.211
-1.18%
jan 1, 2011
496.728
+59.671
13.65%
jan 1, 2012
496.116
-0.612
-0.12%
jan 1, 2013
521.74
+25.624
5.16%
jan 1, 2014
543.886
+22.146
4.24%
jan 1, 2015
681.612
+137.725
25.32%
Ranking of countries by current statistics by years


Comments: