29
/
en
AIzaSyAYiBZKx7MnpbEhh9jyipgxe19OcubqV5w
April 1, 2024
256783
Sweden
SWE
true
2
1
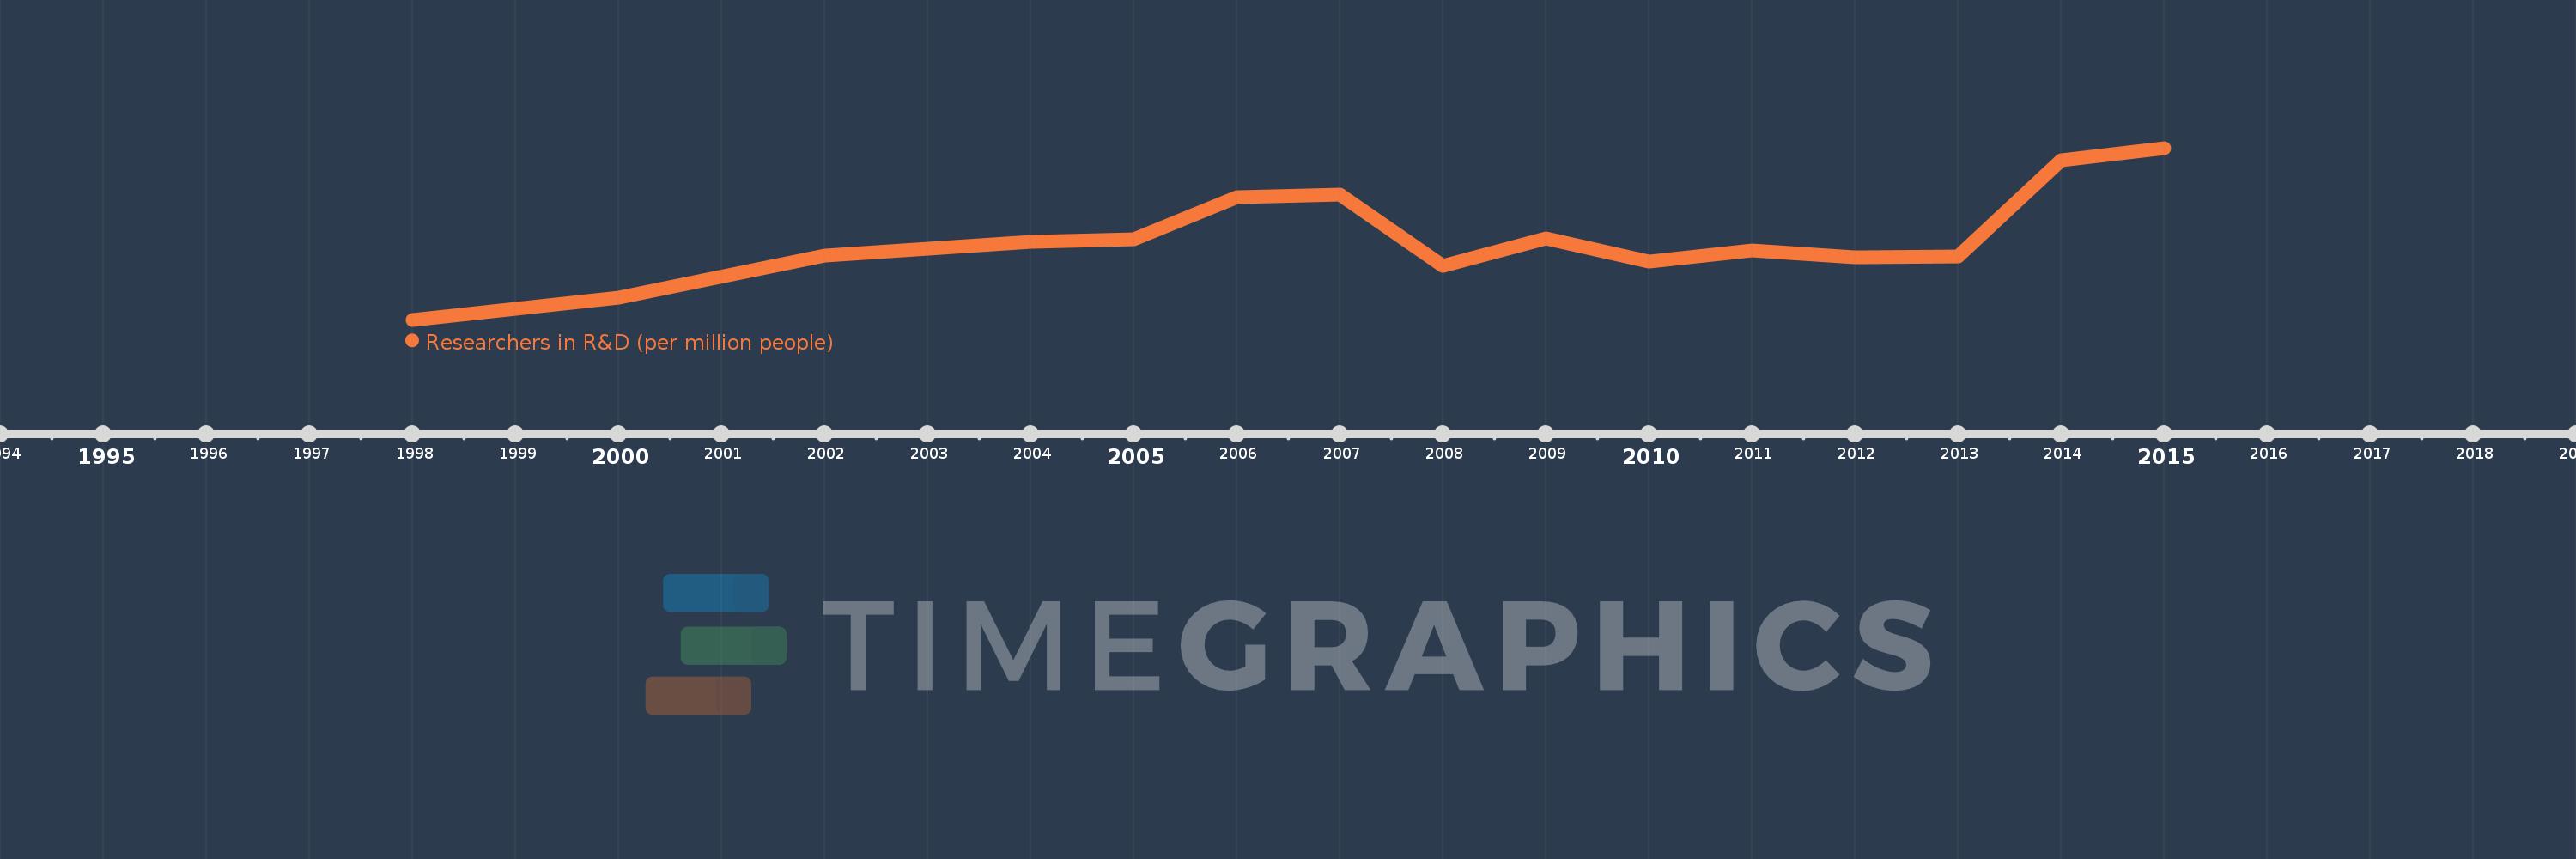
Researchers in R&D (per million people)
2015,2014,2013,2012,2011,2010,2009,2008,2007,2006,2005,2004,2002,2000,1998
This statistics in other country:
Timeline:
This timeline shows a graph from 1998 to 2015 of Sweden. No data until 1997. Number of actual observations by date: 15.
Source name:
World Development Indicators
Source organization:
United Nations Educational, Scientific, and Cultural Organization (UNESCO) Institute for Statistics.
Categories, topics:
Science & Technology
Last updated:
apr 23, 2017
Indicators value changes by year
Minimum:
4.163K
jan 1, 1998
Maximum:
6.868K
jan 1, 2015
At the date of observation
Value
Absolute change
Change from previous value
jan 1, 1998
4.163K
+4.163K
0.0%
jan 1, 2000
4.504K
+341.181
8.2%
jan 1, 2002
5.175K
+670.701
14.89%
jan 1, 2004
5.388K
+213.565
4.13%
jan 1, 2005
5.431K
+42.967
0.8%
jan 1, 2006
6.091K
+659.672
12.15%
jan 1, 2007
6.133K
+41.849
0.69%
jan 1, 2008
5.005K
-1.128K
-18.39%
jan 1, 2009
5.443K
+438.154
8.75%
jan 1, 2010
5.085K
-358.11
-6.58%
jan 1, 2011
5.256K
+170.851
3.36%
jan 1, 2012
5.147K
-108.933
-2.07%
jan 1, 2013
5.164K
+16.824
0.33%
jan 1, 2014
6.67K
+1.506K
29.17%
jan 1, 2015
6.868K
+198.085
2.97%
Ranking of countries by current statistics by years


Comments: