29
/
en
AIzaSyAYiBZKx7MnpbEhh9jyipgxe19OcubqV5w
April 1, 2024
277085
United States
USA
true
2
1
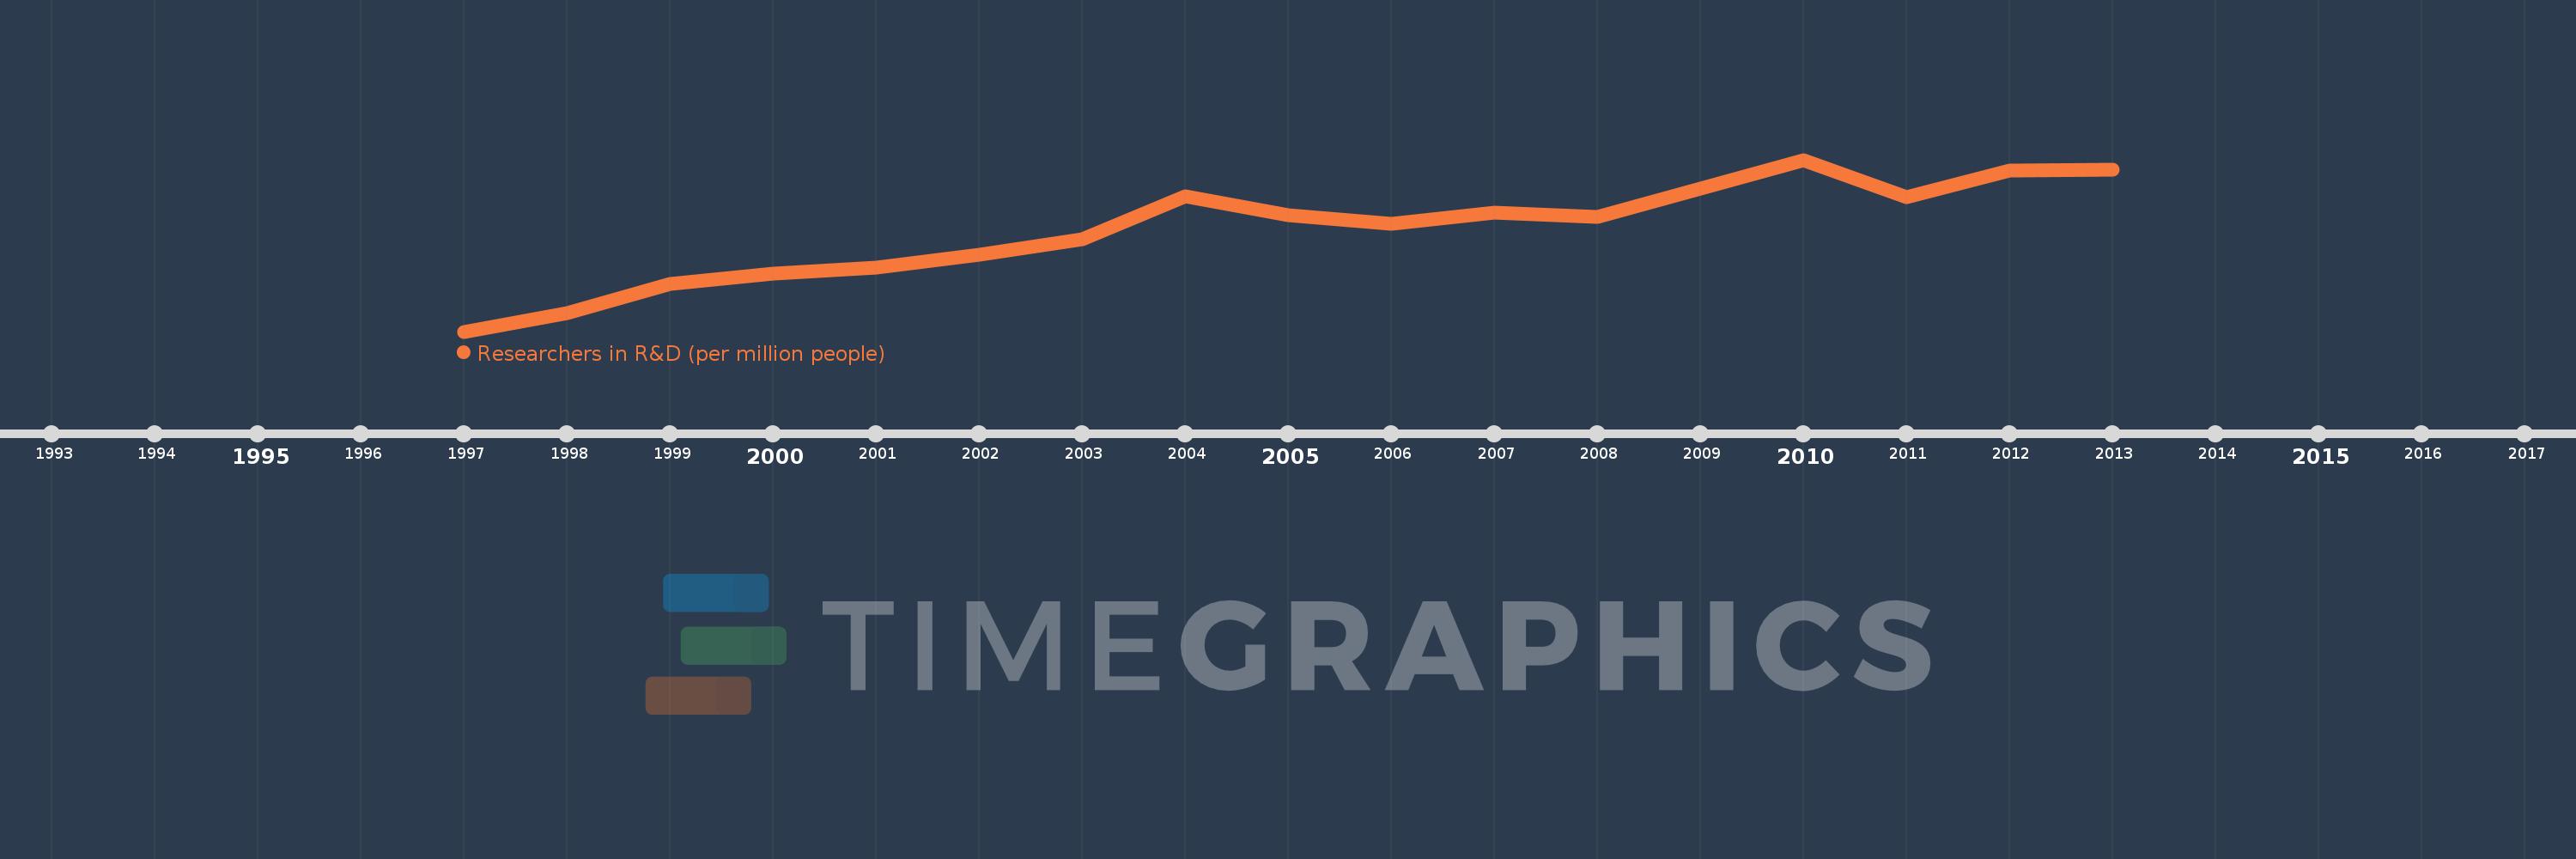
Researchers in R&D (per million people)
2013,2012,2011,2010,2009,2008,2007,2006,2005,2004,2003,2002,2001,2000,1999,1998,1997
This statistics in other country:
Timeline:
This timeline shows a graph from 1997 to 2013 of United States. No data until 1996. Number of actual observations by date: 17.
Source name:
World Development Indicators
Source organization:
United Nations Educational, Scientific, and Cultural Organization (UNESCO) Institute for Statistics.
Categories, topics:
Science & Technology
Last updated:
apr 23, 2017
Indicators value changes by year
Minimum:
3.122K
jan 1, 1997
Maximum:
4.072K
jan 1, 2010
At the date of observation
Value
Absolute change
Change from previous value
jan 1, 1997
3.122K
+3.122K
0.0%
jan 1, 1998
3.224K
+101.656
3.26%
jan 1, 1999
3.388K
+163.956
5.09%
jan 1, 2000
3.445K
+57.096
1.69%
jan 1, 2001
3.476K
+30.41
0.88%
jan 1, 2002
3.546K
+70.042
2.02%
jan 1, 2003
3.63K
+84.765
2.39%
jan 1, 2004
3.87K
+239.884
6.61%
jan 1, 2005
3.765K
-105.367
-2.72%
jan 1, 2006
3.718K
-46.79
-1.24%
jan 1, 2007
3.782K
+63.587
1.71%
jan 1, 2008
3.758K
-23.854
-0.63%
jan 1, 2009
3.912K
+153.972
4.1%
jan 1, 2010
4.072K
+160.034
4.09%
jan 1, 2011
3.867K
-204.826
-5.03%
jan 1, 2012
4.011K
+143.879
3.72%
jan 1, 2013
4.019K
+7.793
0.19%
Ranking of countries by current statistics by years


Comments: