29
/
en
AIzaSyAYiBZKx7MnpbEhh9jyipgxe19OcubqV5w
April 1, 2024
158920
Iraq
IRQ
true
2
1
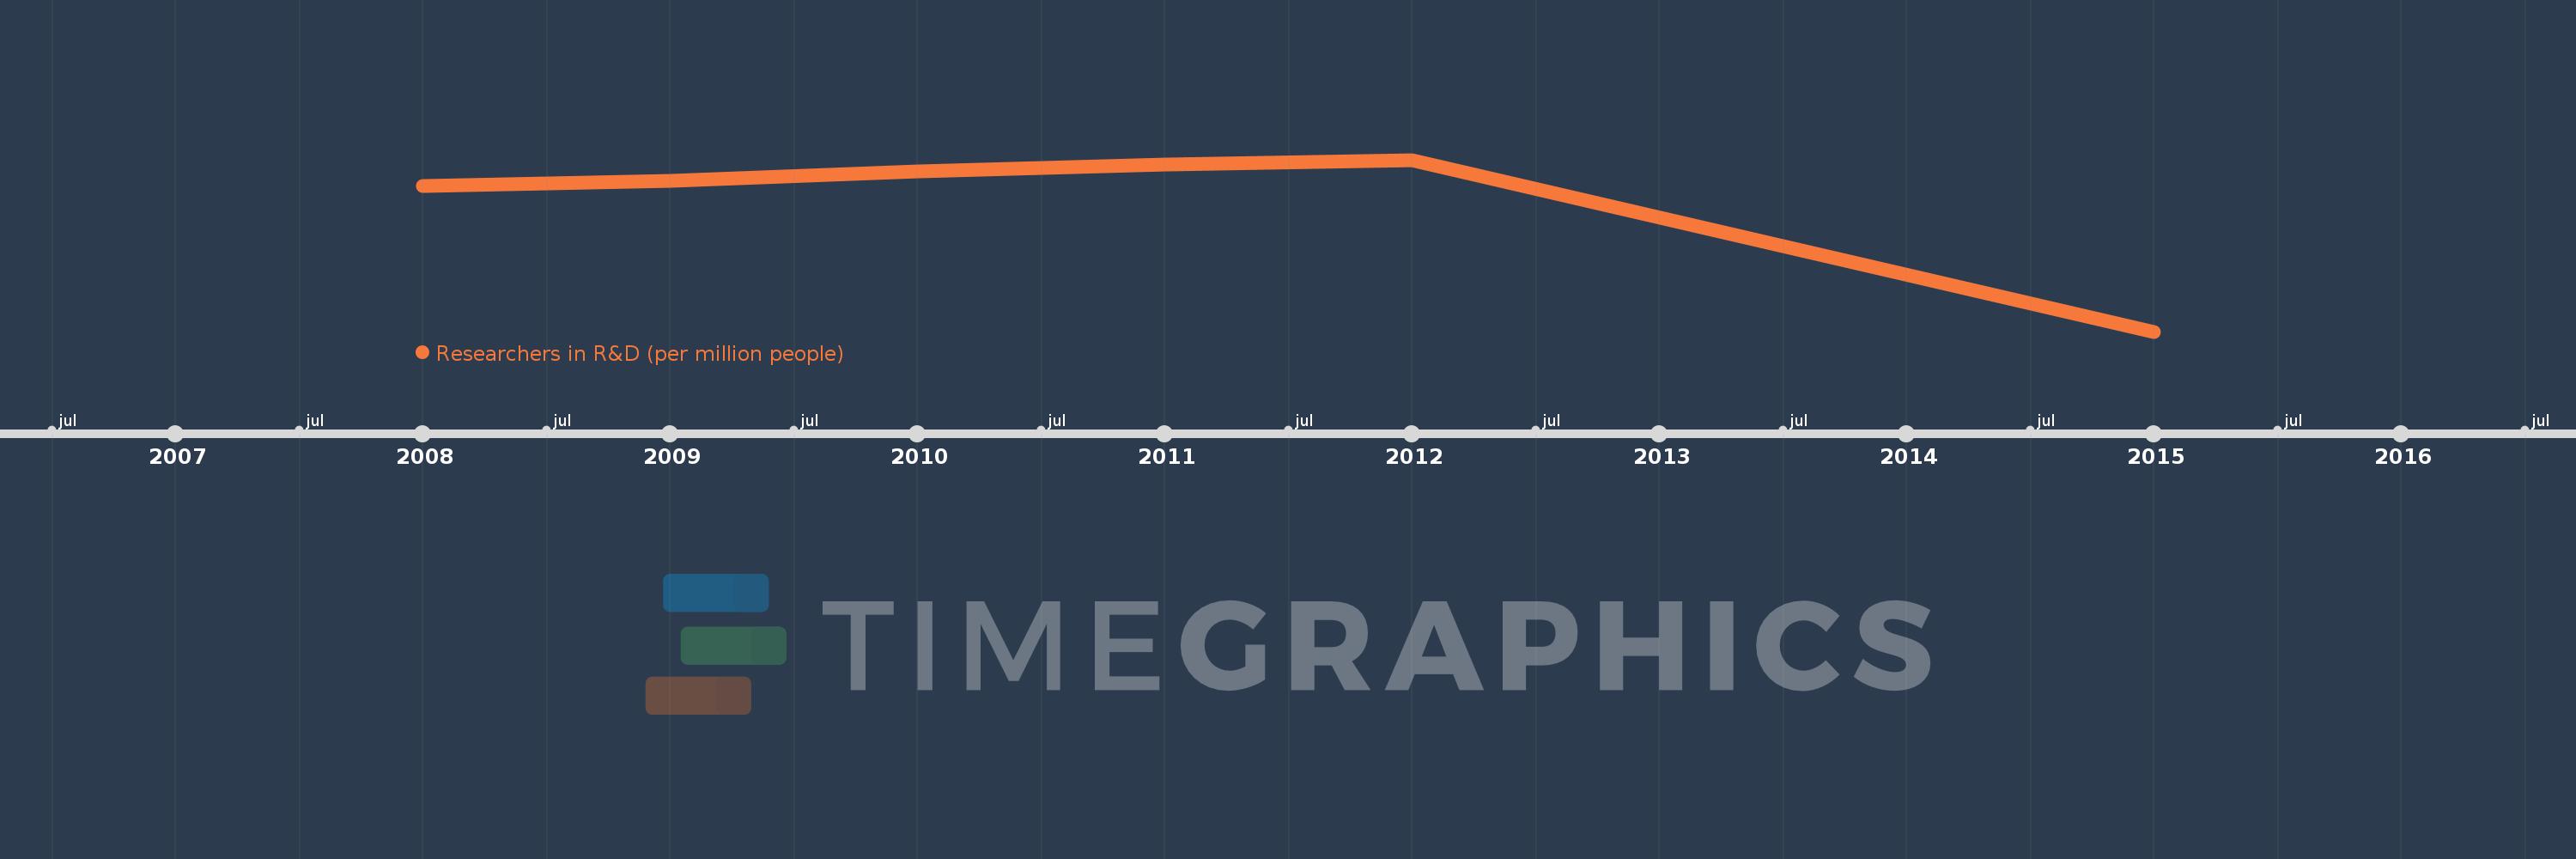
Researchers in R&D (per million people)
2015,2012,2011,2010,2009,2008
This statistics in other country:
Timeline:
This timeline shows a graph from 2008 to 2015 of Iraq. No data until 2007. Number of actual observations by date: 6.
Source name:
World Development Indicators
Source organization:
United Nations Educational, Scientific, and Cultural Organization (UNESCO) Institute for Statistics.
Categories, topics:
Science & Technology
Last updated:
apr 23, 2017
Indicators value changes by year
Maximum:
425.477
jan 1, 2012
At the date of observation
Value
Absolute change
Change from previous value
jan 1, 2008
370.714
+370.714
0.0%
jan 1, 2009
381.026
+10.313
2.78%
jan 1, 2010
401.993
+20.967
5.5%
jan 1, 2011
416.254
+14.261
3.55%
jan 1, 2012
425.477
+9.223
2.22%
jan 1, 2015
67.87
-357.607
-84.05%
Ranking of countries by current statistics by years


Comments: