29
/
en
AIzaSyAYiBZKx7MnpbEhh9jyipgxe19OcubqV5w
April 1, 2024
34176
Fragile and conflict affected situations
FCS
false
2
1
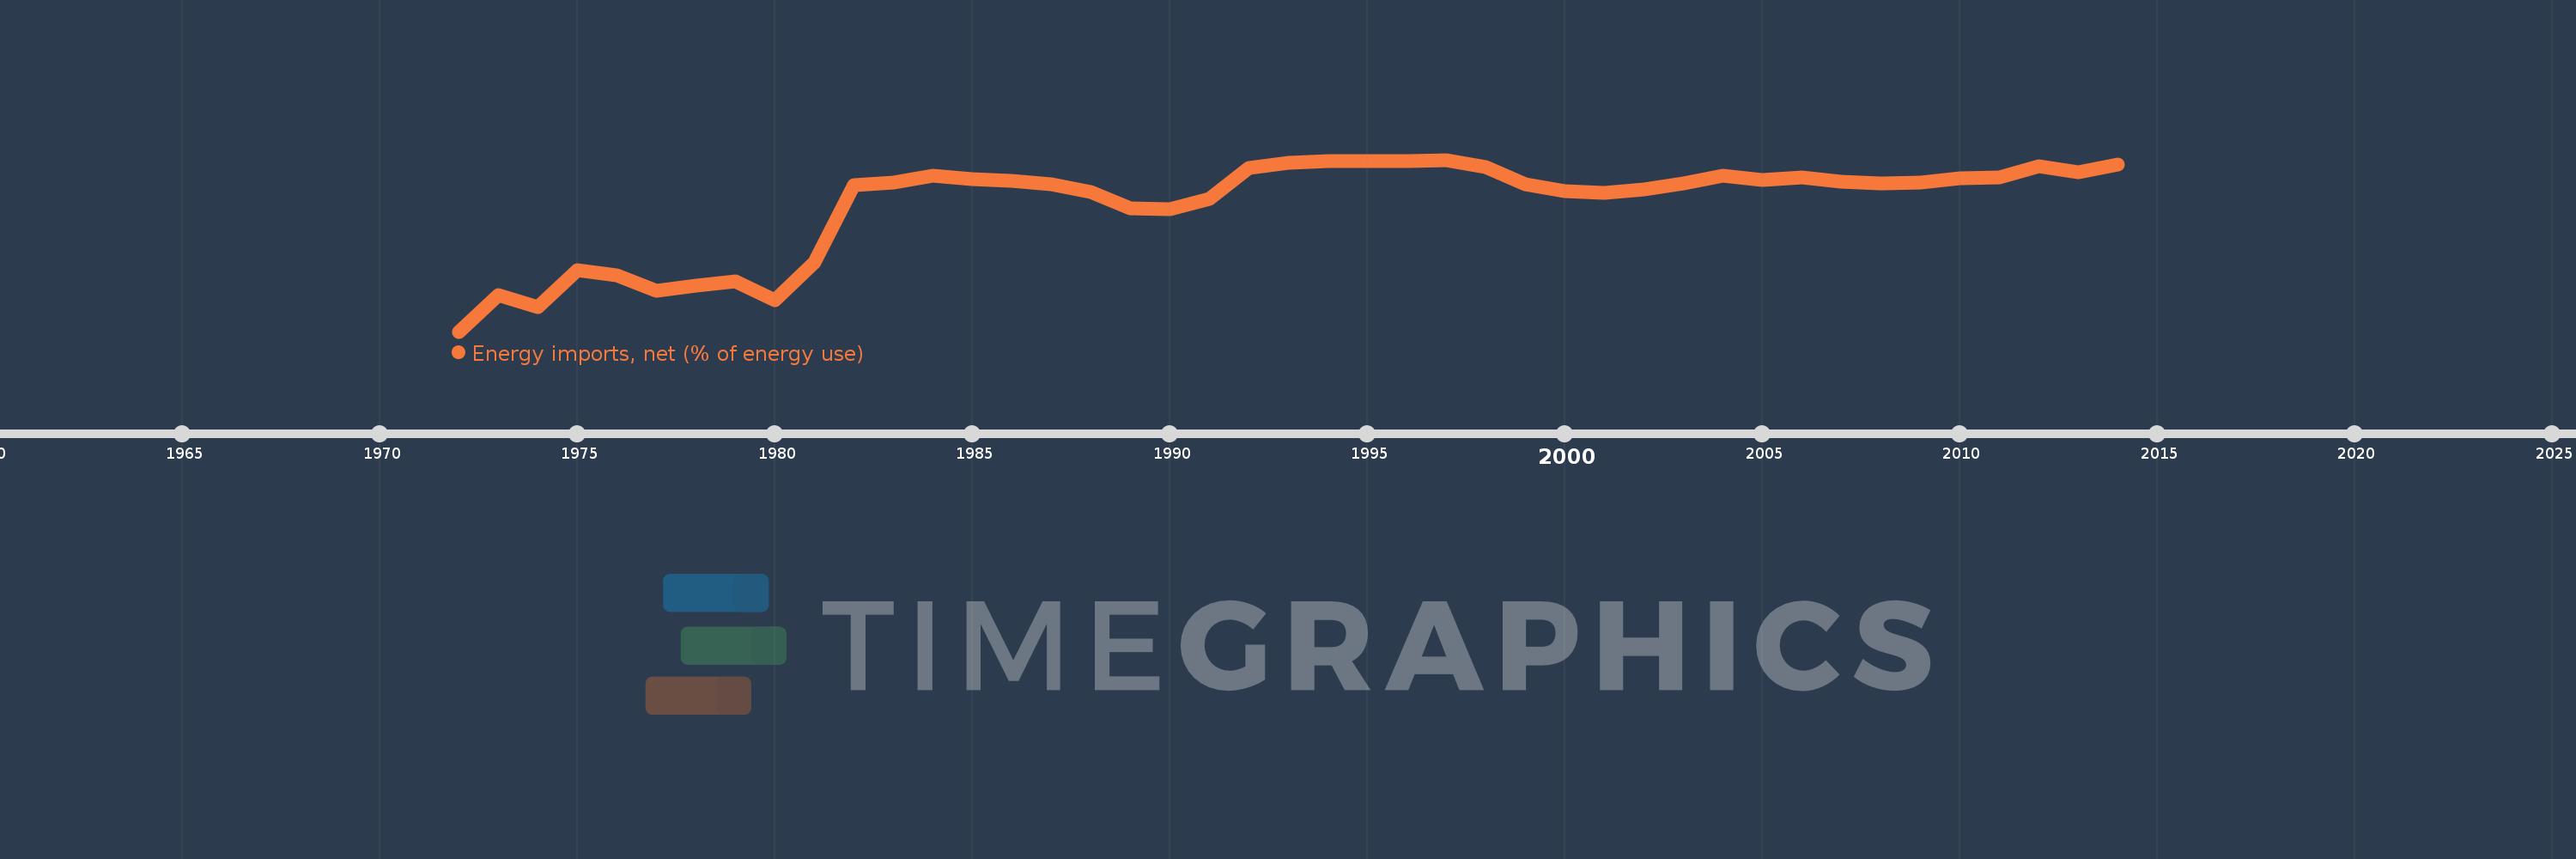
Energy imports, net (% of energy use)
2014,2013,2012,2011,2010,2009,2008,2007,2006,2005,2004,2003,2002,2001,2000,1999,1998,1997,1996,1995,1994,1993,1992,1991,1990,1989,1988,1987,1986,1985,1984,1983,1982,1981,1980,1979,1978,1977,1976,1975,1974,1973,1972
This statistics in other country:
AlbaniaAlgeriaAngolaArab WorldArgentinaArmeniaAustraliaAustriaAzerbaijanBahrainBangladeshBelarusBelgiumBeninBoliviaBosnia and HerzegovinaBotswanaBrazilBrunei DarussalamBulgariaCambodiaCameroonCanadaCaribbean small statesCentral Europe and the BalticsChileChinaColombiaCongo, Dem. Rep.Congo, Rep.Costa RicaCote d'IvoireCroatiaCubaCuracaoCyprusCzech RepublicDenmarkDominican RepublicEarly-demographic dividendEast Asia & PacificEast Asia & Pacific (excluding high income)East Asia & Pacific (IDA & IBRD countries)EcuadorEgypt, Arab Rep.El SalvadorEritreaEstoniaEthiopiaEuro areaEurope & Central AsiaEurope & Central Asia (excluding high income)Europe & Central Asia (IDA & IBRD countries)European UnionFinlandFragile and conflict affected situationsFranceGabonGeorgiaGermanyGhanaGibraltarGreeceGuatemalaHaitiHeavily indebted poor countries (HIPC)High incomeHondurasHong Kong SAR, ChinaHungaryIBRD onlyIcelandIDA & IBRD totalIDA blendIDA onlyIDA totalIndiaIndonesiaIran, Islamic Rep.IraqIrelandIsraelItalyJamaicaJapanJordanKazakhstanKenyaKorea, Dem. People’s Rep.Korea, Rep.KosovoKuwaitKyrgyz RepublicLate-demographic dividendLatin America & Caribbean Latin America & Caribbean (excluding high income)Latin America & the Caribbean (IDA & IBRD countries)LatviaLeast developed countries: UN classificationLebanonLibyaLithuaniaLow & middle incomeLow incomeLower middle incomeLuxembourgMacedonia, FYRMalaysiaMaltaMauritiusMexicoMiddle East & North AfricaMiddle East & North Africa (excluding high income)Middle East & North Africa (IDA & IBRD countries)Middle incomeMoldovaMongoliaMontenegroMoroccoMozambiqueMyanmarNamibiaNepalNetherlandsNew ZealandNicaraguaNigerNigeriaNorth AmericaNorwayOECD membersOmanOther small statesPakistanPanamaParaguayPeruPhilippinesPolandPortugalPost-demographic dividendPre-demographic dividendQatarRomaniaRussian FederationSaudi ArabiaSenegalSerbiaSingaporeSlovak RepublicSloveniaSmall statesSouth AfricaSouth AsiaSouth Asia (IDA & IBRD)South SudanSpainSri LankaSub-Saharan Africa Sub-Saharan Africa (excluding high income)Sub-Saharan Africa (IDA & IBRD countries)SudanSwedenSwitzerlandSyrian Arab RepublicTajikistanTanzaniaThailandTogoTrinidad and TobagoTunisiaTurkeyTurkmenistanUkraineUnited Arab EmiratesUnited KingdomUnited StatesUpper middle incomeUruguayUzbekistanVenezuela, RBVietnamWorldYemen, Rep.ZambiaZimbabwe Timeline:
This timeline shows a graph from 1972 to 2014 of Fragile and conflict affected situations. No data until 1971. Number of actual observations by date: 43.
Source name:
World Development Indicators
Source organization:
IEA Statistics © OECD/IEA 2014 (http://www.iea.org/stats/index.asp), subject to https://www.iea.org/t&c/termsandconditions/
Categories, topics:
Energy & Mining, Trade
Last updated:
apr 23, 2017
Indicators value changes by year
Minimum:
-506.98
jan 1, 1972
Maximum:
-75.203
jan 1, 1997
At the date of observation
Value
Absolute change
Change from previous value
jan 1, 1972
-506.98
-506.98
0.0%
jan 1, 1973
-415.406
+91.574
-18.06%
jan 1, 1974
-445.017
-29.61
7.13%
jan 1, 1975
-351.749
+93.268
-20.96%
jan 1, 1976
-365.241
-13.492
3.84%
jan 1, 1977
-404.996
-39.755
10.88%
jan 1, 1978
-392.372
+12.625
-3.12%
jan 1, 1979
-381.481
+10.891
-2.78%
jan 1, 1980
-428.682
-47.201
12.37%
jan 1, 1981
-332.795
+95.888
-22.37%
jan 1, 1982
-138.306
+194.489
-58.44%
jan 1, 1983
-132.587
+5.719
-4.13%
jan 1, 1984
-115.776
+16.811
-12.68%
jan 1, 1985
-124.787
-9.01
7.78%
jan 1, 1986
-127.539
-2.752
2.21%
jan 1, 1987
-135.977
-8.438
6.62%
jan 1, 1988
-156.747
-20.771
15.28%
jan 1, 1989
-196.758
-40.011
25.53%
jan 1, 1990
-198.352
-1.595
0.81%
jan 1, 1991
-173.666
+24.687
-12.45%
jan 1, 1992
-94.844
+78.821
-45.39%
jan 1, 1993
-83.624
+11.22
-11.83%
jan 1, 1994
-77.43
+6.194
-7.41%
jan 1, 1995
-77.718
-0.288
0.37%
jan 1, 1996
-77.732
-0.013
0.02%
jan 1, 1997
-75.203
+2.529
-3.25%
jan 1, 1998
-93.041
-17.837
23.72%
jan 1, 1999
-135.834
-42.793
45.99%
jan 1, 2000
-154.259
-18.425
13.56%
jan 1, 2001
-157.616
-3.358
2.18%
jan 1, 2002
-148.868
+8.749
-5.55%
jan 1, 2003
-135.196
+13.672
-9.18%
jan 1, 2004
-115.782
+19.414
-14.36%
jan 1, 2005
-125.692
-9.91
8.56%
jan 1, 2006
-118.465
+7.227
-5.75%
jan 1, 2007
-130.193
-11.728
9.9%
jan 1, 2008
-134.421
-4.229
3.25%
jan 1, 2009
-131.588
+2.833
-2.11%
jan 1, 2010
-120.594
+10.995
-8.36%
jan 1, 2011
-118.886
+1.707
-1.42%
jan 1, 2012
-90.568
+28.318
-23.82%
jan 1, 2013
-106.093
-15.524
17.14%
jan 1, 2014
-86.783
+19.31
-18.2%
Ranking of countries by current statistics by years


Comments: