29
/
en
AIzaSyAYiBZKx7MnpbEhh9jyipgxe19OcubqV5w
April 1, 2024
123403
Ecuador
ECU
true
2
1
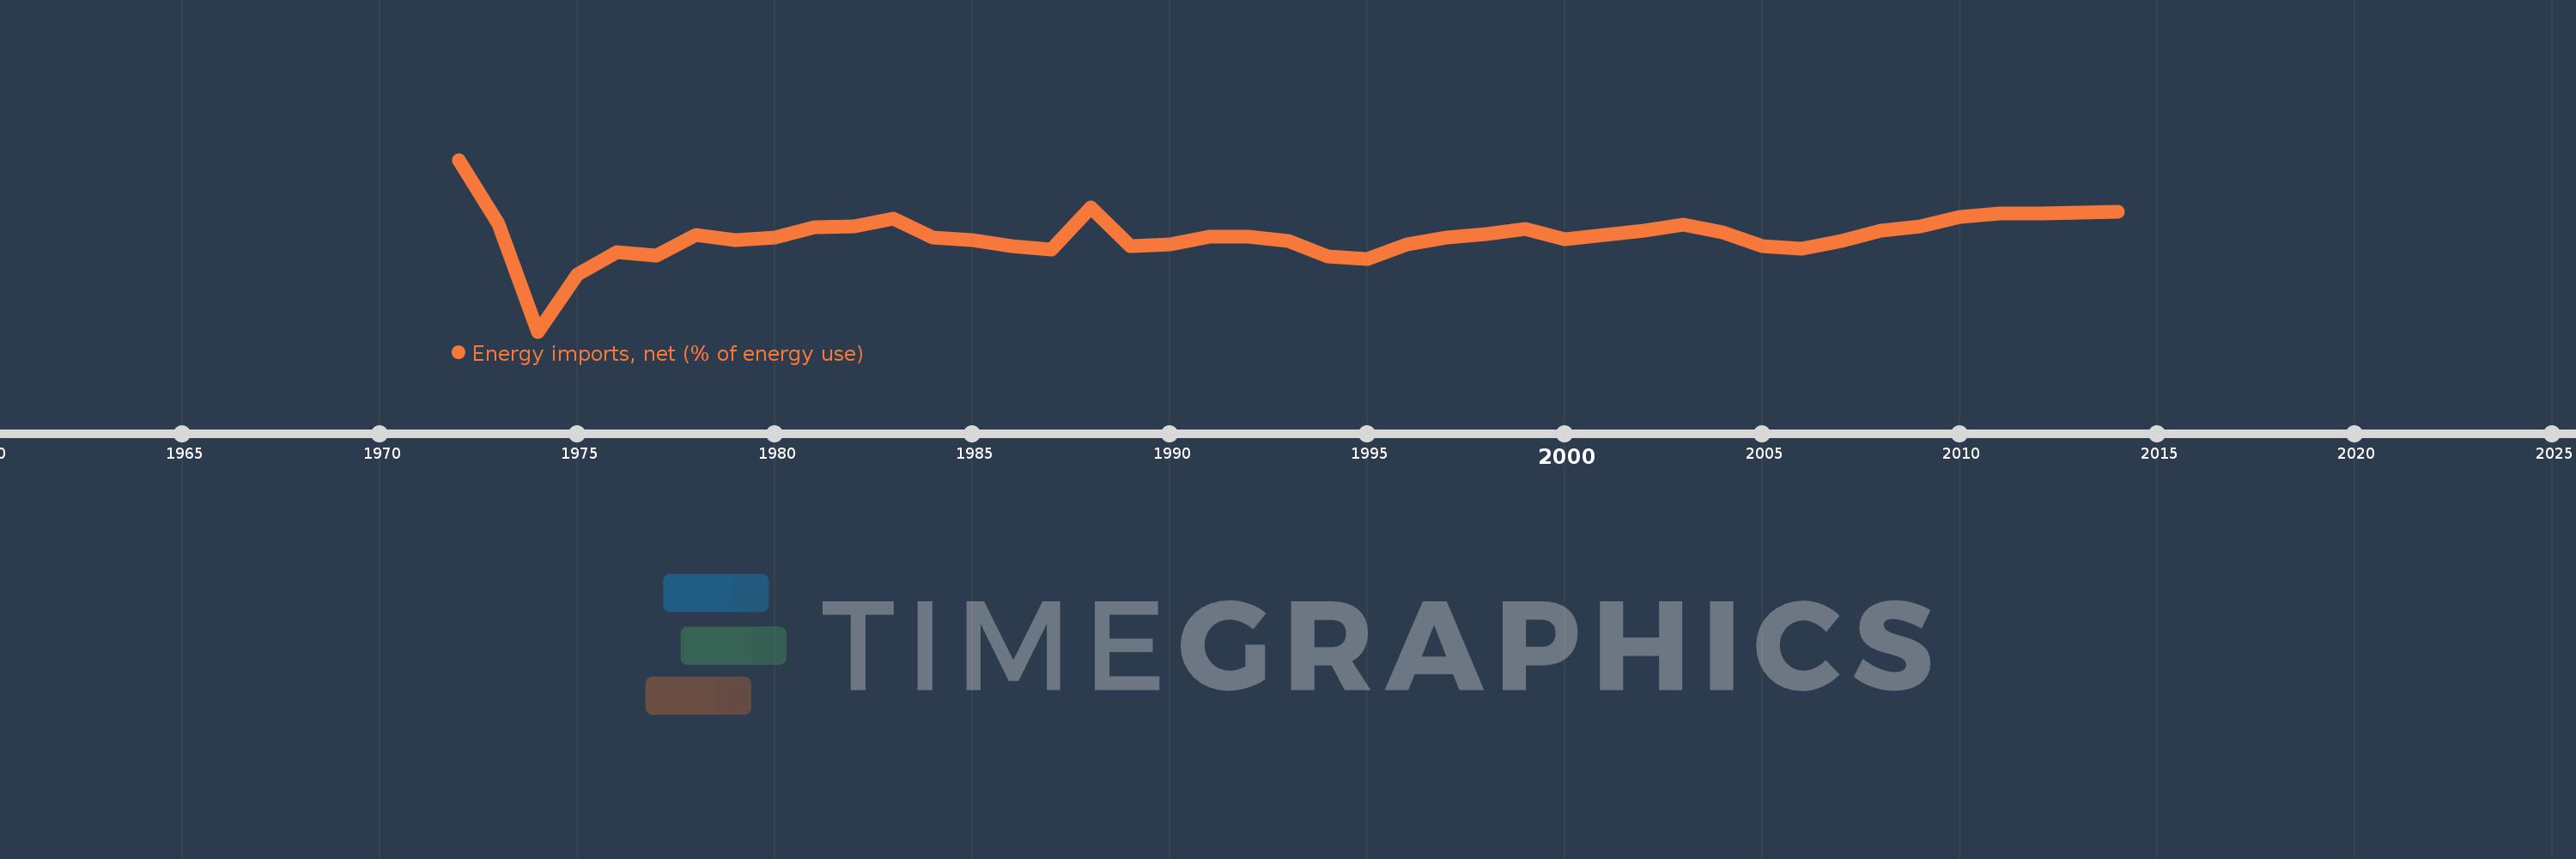
Energy imports, net (% of energy use)
2014,2013,2012,2011,2010,2009,2008,2007,2006,2005,2004,2003,2002,2001,2000,1999,1998,1997,1996,1995,1994,1993,1992,1991,1990,1989,1988,1987,1986,1985,1984,1983,1982,1981,1980,1979,1978,1977,1976,1975,1974,1973,1972
This statistics in other country:
AlbaniaAlgeriaAngolaArab WorldArgentinaArmeniaAustraliaAustriaAzerbaijanBahrainBangladeshBelarusBelgiumBeninBoliviaBosnia and HerzegovinaBotswanaBrazilBrunei DarussalamBulgariaCambodiaCameroonCanadaCaribbean small statesCentral Europe and the BalticsChileChinaColombiaCongo, Dem. Rep.Congo, Rep.Costa RicaCote d'IvoireCroatiaCubaCuracaoCyprusCzech RepublicDenmarkDominican RepublicEarly-demographic dividendEast Asia & PacificEast Asia & Pacific (excluding high income)East Asia & Pacific (IDA & IBRD countries)EcuadorEgypt, Arab Rep.El SalvadorEritreaEstoniaEthiopiaEuro areaEurope & Central AsiaEurope & Central Asia (excluding high income)Europe & Central Asia (IDA & IBRD countries)European UnionFinlandFragile and conflict affected situationsFranceGabonGeorgiaGermanyGhanaGibraltarGreeceGuatemalaHaitiHeavily indebted poor countries (HIPC)High incomeHondurasHong Kong SAR, ChinaHungaryIBRD onlyIcelandIDA & IBRD totalIDA blendIDA onlyIDA totalIndiaIndonesiaIran, Islamic Rep.IraqIrelandIsraelItalyJamaicaJapanJordanKazakhstanKenyaKorea, Dem. People’s Rep.Korea, Rep.KosovoKuwaitKyrgyz RepublicLate-demographic dividendLatin America & Caribbean Latin America & Caribbean (excluding high income)Latin America & the Caribbean (IDA & IBRD countries)LatviaLeast developed countries: UN classificationLebanonLibyaLithuaniaLow & middle incomeLow incomeLower middle incomeLuxembourgMacedonia, FYRMalaysiaMaltaMauritiusMexicoMiddle East & North AfricaMiddle East & North Africa (excluding high income)Middle East & North Africa (IDA & IBRD countries)Middle incomeMoldovaMongoliaMontenegroMoroccoMozambiqueMyanmarNamibiaNepalNetherlandsNew ZealandNicaraguaNigerNigeriaNorth AmericaNorwayOECD membersOmanOther small statesPakistanPanamaParaguayPeruPhilippinesPolandPortugalPost-demographic dividendPre-demographic dividendQatarRomaniaRussian FederationSaudi ArabiaSenegalSerbiaSingaporeSlovak RepublicSloveniaSmall statesSouth AfricaSouth AsiaSouth Asia (IDA & IBRD)South SudanSpainSri LankaSub-Saharan Africa Sub-Saharan Africa (excluding high income)Sub-Saharan Africa (IDA & IBRD countries)SudanSwedenSwitzerlandSyrian Arab RepublicTajikistanTanzaniaThailandTogoTrinidad and TobagoTunisiaTurkeyTurkmenistanUkraineUnited Arab EmiratesUnited KingdomUnited StatesUpper middle incomeUruguayUzbekistanVenezuela, RBVietnamWorldYemen, Rep.ZambiaZimbabwe Timeline:
This timeline shows a graph from 1972 to 2014 of Ecuador. No data until 1971. Number of actual observations by date: 43.
Source name:
World Development Indicators
Source organization:
IEA Statistics © OECD/IEA 2014 (http://www.iea.org/stats/index.asp), subject to https://www.iea.org/t&c/termsandconditions/
Categories, topics:
Energy & Mining, Trade
Last updated:
apr 23, 2017
Indicators value changes by year
Minimum:
-403.963
jan 1, 1974
Maximum:
40.806
jan 1, 1972
At the date of observation
Value
Absolute change
Change from previous value
jan 1, 1972
40.806
+40.806
0.0%
jan 1, 1973
-124.884
-165.69
-406.05%
jan 1, 1974
-403.963
-279.079
223.47%
jan 1, 1975
-256.167
+147.796
-36.59%
jan 1, 1976
-197.425
+58.742
-22.93%
jan 1, 1977
-206.855
-9.43
4.78%
jan 1, 1978
-154.123
+52.732
-25.49%
jan 1, 1979
-167.118
-12.995
8.43%
jan 1, 1980
-160.44
+6.678
-4.0%
jan 1, 1981
-134.379
+26.061
-16.24%
jan 1, 1982
-130.563
+3.816
-2.84%
jan 1, 1983
-111.795
+18.768
-14.37%
jan 1, 1984
-161.126
-49.331
44.13%
jan 1, 1985
-166.22
-5.094
3.16%
jan 1, 1986
-181.687
-15.466
9.3%
jan 1, 1987
-190.983
-9.296
5.12%
jan 1, 1988
-81.776
+109.207
-57.18%
jan 1, 1989
-182.458
-100.682
123.12%
jan 1, 1990
-177.247
+5.211
-2.86%
jan 1, 1991
-159.063
+18.184
-10.26%
jan 1, 1992
-158.556
+0.507
-0.32%
jan 1, 1993
-168.694
-10.139
6.39%
jan 1, 1994
-208.554
-39.86
23.63%
jan 1, 1995
-215.816
-7.262
3.48%
jan 1, 1996
-177.912
+37.904
-17.56%
jan 1, 1997
-160.965
+16.947
-9.53%
jan 1, 1998
-152.224
+8.741
-5.43%
jan 1, 1999
-139.062
+13.162
-8.65%
jan 1, 2000
-165.222
-26.16
18.81%
jan 1, 2001
-154.292
+10.931
-6.62%
jan 1, 2002
-142.467
+11.824
-7.66%
jan 1, 2003
-128.09
+14.378
-10.09%
jan 1, 2004
-146.842
-18.752
14.64%
jan 1, 2005
-182.289
-35.447
24.14%
jan 1, 2006
-189.521
-7.232
3.97%
jan 1, 2007
-170.085
+19.436
-10.26%
jan 1, 2008
-141.661
+28.423
-16.71%
jan 1, 2009
-130.537
+11.124
-7.85%
jan 1, 2010
-107.348
+23.189
-17.76%
jan 1, 2011
-98.382
+8.966
-8.35%
jan 1, 2012
-98.398
-0.016
0.02%
jan 1, 2013
-96.972
+1.426
-1.45%
jan 1, 2014
-93.756
+3.216
-3.32%
Ranking of countries by current statistics by years


Comments: