29
/
en
AIzaSyAYiBZKx7MnpbEhh9jyipgxe19OcubqV5w
April 1, 2024
31518
Europe & Central Asia (excluding high income)
ECA
false
2
1
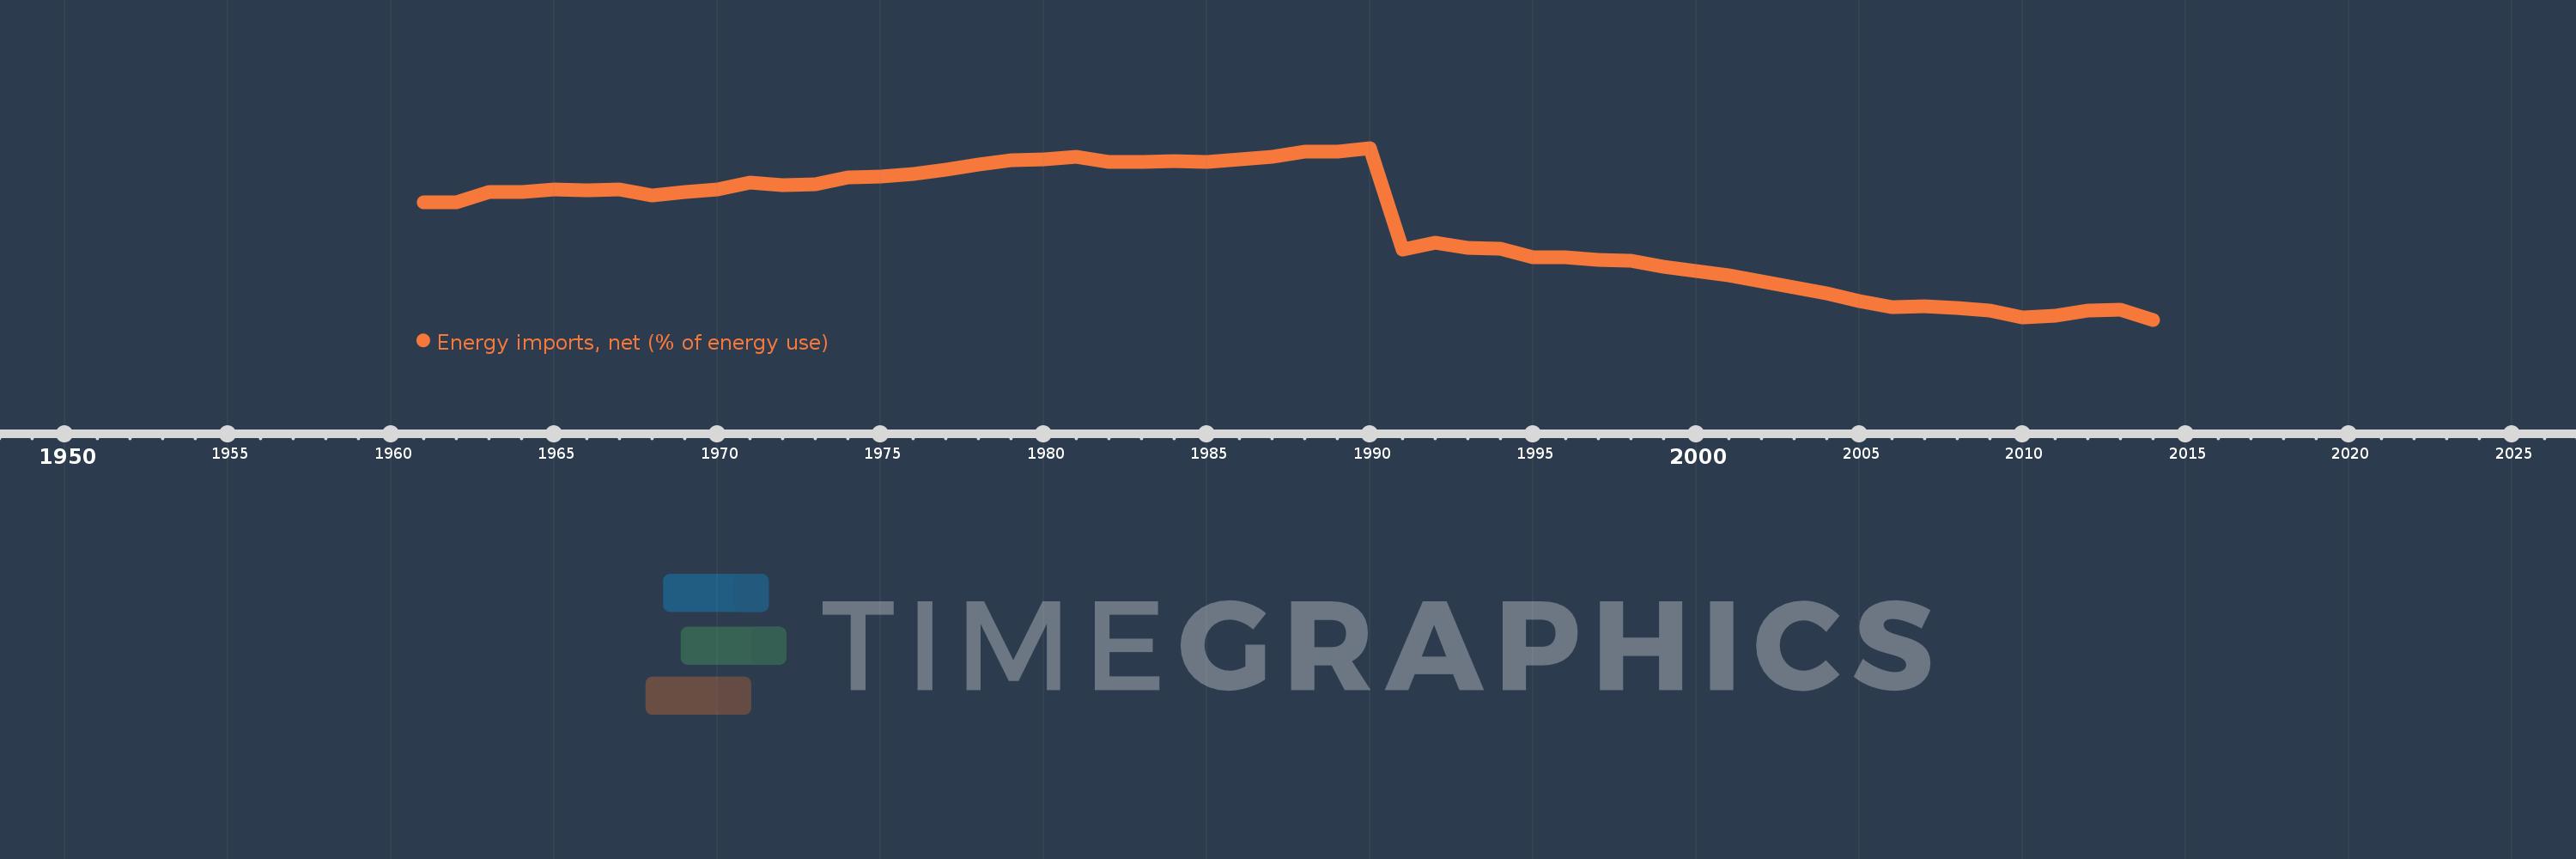
Energy imports, net (% of energy use)
2014,2013,2012,2011,2010,2009,2008,2007,2006,2005,2004,2003,2002,2001,2000,1999,1998,1997,1996,1995,1994,1993,1992,1991,1990,1989,1988,1987,1986,1985,1984,1983,1982,1981,1980,1979,1978,1977,1976,1975,1974,1973,1972,1971,1970,1969,1968,1967,1966,1965,1964,1963,1962,1961
This statistics in other country:
AlbaniaAlgeriaAngolaArab WorldArgentinaArmeniaAustraliaAustriaAzerbaijanBahrainBangladeshBelarusBelgiumBeninBoliviaBosnia and HerzegovinaBotswanaBrazilBrunei DarussalamBulgariaCambodiaCameroonCanadaCaribbean small statesCentral Europe and the BalticsChileChinaColombiaCongo, Dem. Rep.Congo, Rep.Costa RicaCote d'IvoireCroatiaCubaCuracaoCyprusCzech RepublicDenmarkDominican RepublicEarly-demographic dividendEast Asia & PacificEast Asia & Pacific (excluding high income)East Asia & Pacific (IDA & IBRD countries)EcuadorEgypt, Arab Rep.El SalvadorEritreaEstoniaEthiopiaEuro areaEurope & Central AsiaEurope & Central Asia (excluding high income)Europe & Central Asia (IDA & IBRD countries)European UnionFinlandFragile and conflict affected situationsFranceGabonGeorgiaGermanyGhanaGibraltarGreeceGuatemalaHaitiHeavily indebted poor countries (HIPC)High incomeHondurasHong Kong SAR, ChinaHungaryIBRD onlyIcelandIDA & IBRD totalIDA blendIDA onlyIDA totalIndiaIndonesiaIran, Islamic Rep.IraqIrelandIsraelItalyJamaicaJapanJordanKazakhstanKenyaKorea, Dem. People’s Rep.Korea, Rep.KosovoKuwaitKyrgyz RepublicLate-demographic dividendLatin America & Caribbean Latin America & Caribbean (excluding high income)Latin America & the Caribbean (IDA & IBRD countries)LatviaLeast developed countries: UN classificationLebanonLibyaLithuaniaLow & middle incomeLow incomeLower middle incomeLuxembourgMacedonia, FYRMalaysiaMaltaMauritiusMexicoMiddle East & North AfricaMiddle East & North Africa (excluding high income)Middle East & North Africa (IDA & IBRD countries)Middle incomeMoldovaMongoliaMontenegroMoroccoMozambiqueMyanmarNamibiaNepalNetherlandsNew ZealandNicaraguaNigerNigeriaNorth AmericaNorwayOECD membersOmanOther small statesPakistanPanamaParaguayPeruPhilippinesPolandPortugalPost-demographic dividendPre-demographic dividendQatarRomaniaRussian FederationSaudi ArabiaSenegalSerbiaSingaporeSlovak RepublicSloveniaSmall statesSouth AfricaSouth AsiaSouth Asia (IDA & IBRD)South SudanSpainSri LankaSub-Saharan Africa Sub-Saharan Africa (excluding high income)Sub-Saharan Africa (IDA & IBRD countries)SudanSwedenSwitzerlandSyrian Arab RepublicTajikistanTanzaniaThailandTogoTrinidad and TobagoTunisiaTurkeyTurkmenistanUkraineUnited Arab EmiratesUnited KingdomUnited StatesUpper middle incomeUruguayUzbekistanVenezuela, RBVietnamWorldYemen, Rep.ZambiaZimbabwe Timeline:
This timeline shows a graph from 1961 to 2014 of Europe & Central Asia (excluding high income). No data until 1960. Number of actual observations by date: 54.
Source name:
World Development Indicators
Source organization:
IEA Statistics © OECD/IEA 2014 (http://www.iea.org/stats/index.asp), subject to https://www.iea.org/t&c/termsandconditions/
Categories, topics:
Energy & Mining, Trade
Last updated:
apr 23, 2017
Indicators value changes by year
Minimum:
-50.86
jan 1, 2014
Maximum:
41.642
jan 1, 1990
At the date of observation
Value
Absolute change
Change from previous value
jan 1, 1961
12.336
+12.336
0.0%
jan 1, 1962
12.587
+0.251
2.04%
jan 1, 1963
17.942
+5.355
42.55%
jan 1, 1964
18.026
+0.084
0.47%
jan 1, 1965
19.244
+1.217
6.75%
jan 1, 1966
18.82
-0.423
-2.2%
jan 1, 1967
19.351
+0.531
2.82%
jan 1, 1968
16.257
-3.094
-15.99%
jan 1, 1969
18.088
+1.832
11.27%
jan 1, 1970
19.436
+1.348
7.45%
jan 1, 1971
23.185
+3.749
19.29%
jan 1, 1972
21.419
-1.766
-7.62%
jan 1, 1973
22.139
+0.72
3.36%
jan 1, 1974
25.603
+3.464
15.65%
jan 1, 1975
26.096
+0.493
1.93%
jan 1, 1976
27.46
+1.364
5.23%
jan 1, 1977
29.939
+2.478
9.02%
jan 1, 1978
32.569
+2.631
8.79%
jan 1, 1979
34.875
+2.305
7.08%
jan 1, 1980
35.701
+0.827
2.37%
jan 1, 1981
36.857
+1.156
3.24%
jan 1, 1982
34.111
-2.746
-7.45%
jan 1, 1983
34.085
-0.026
-0.08%
jan 1, 1984
34.536
+0.451
1.32%
jan 1, 1985
34.225
-0.311
-0.9%
jan 1, 1986
35.673
+1.449
4.23%
jan 1, 1987
36.714
+1.04
2.92%
jan 1, 1988
39.598
+2.884
7.86%
jan 1, 1989
39.456
-0.142
-0.36%
jan 1, 1990
41.642
+2.186
5.54%
jan 1, 1991
-13.262
-54.904
-131.85%
jan 1, 1992
-9.309
+3.953
-29.81%
jan 1, 1993
-12.052
-2.743
29.47%
jan 1, 1994
-12.717
-0.665
5.51%
jan 1, 1995
-17.354
-4.637
36.47%
jan 1, 1996
-17.02
+0.334
-1.92%
jan 1, 1997
-18.399
-1.379
8.1%
jan 1, 1998
-19.188
-0.788
4.29%
jan 1, 1999
-22.175
-2.987
15.57%
jan 1, 2000
-24.459
-2.284
10.3%
jan 1, 2001
-27.062
-2.602
10.64%
jan 1, 2002
-30.351
-3.289
12.15%
jan 1, 2003
-33.555
-3.205
10.56%
jan 1, 2004
-36.651
-3.096
9.23%
jan 1, 2005
-40.885
-4.233
11.55%
jan 1, 2006
-43.994
-3.109
7.6%
jan 1, 2007
-43.433
+0.561
-1.27%
jan 1, 2008
-44.721
-1.288
2.97%
jan 1, 2009
-46.017
-1.296
2.9%
jan 1, 2010
-49.61
-3.593
7.81%
jan 1, 2011
-48.722
+0.888
-1.79%
jan 1, 2012
-45.812
+2.911
-5.97%
jan 1, 2013
-45.449
+0.362
-0.79%
jan 1, 2014
-50.86
-5.411
11.91%
Ranking of countries by current statistics by years


Comments: