29
/
en
AIzaSyAYiBZKx7MnpbEhh9jyipgxe19OcubqV5w
April 1, 2024
72900
Australia
AUS
true
2
1
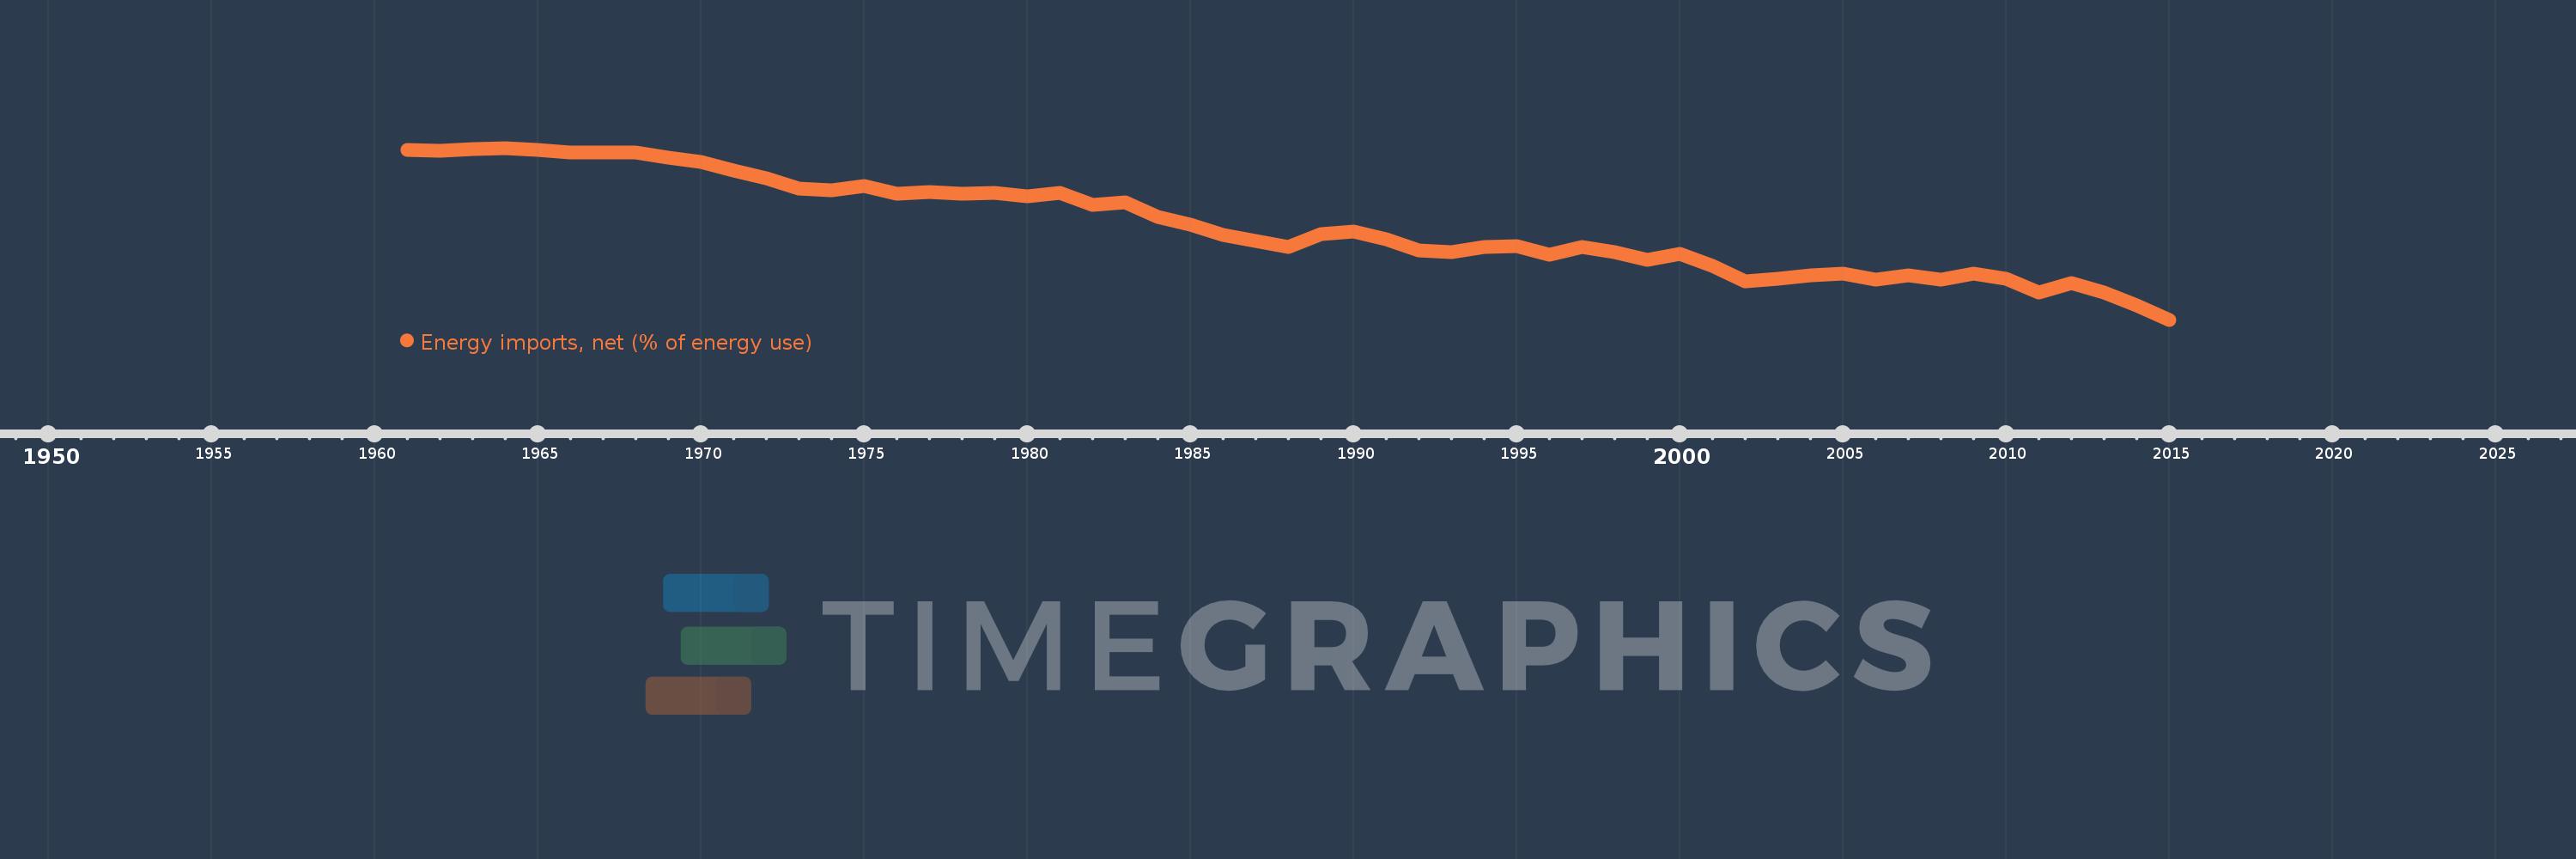
Energy imports, net (% of energy use)
2015,2014,2013,2012,2011,2010,2009,2008,2007,2006,2005,2004,2003,2002,2001,2000,1999,1998,1997,1996,1995,1994,1993,1992,1991,1990,1989,1988,1987,1986,1985,1984,1983,1982,1981,1980,1979,1978,1977,1976,1975,1974,1973,1972,1971,1970,1969,1968,1967,1966,1965,1964,1963,1962,1961
This statistics in other country:
AlbaniaAlgeriaAngolaArab WorldArgentinaArmeniaAustraliaAustriaAzerbaijanBahrainBangladeshBelarusBelgiumBeninBoliviaBosnia and HerzegovinaBotswanaBrazilBrunei DarussalamBulgariaCambodiaCameroonCanadaCaribbean small statesCentral Europe and the BalticsChileChinaColombiaCongo, Dem. Rep.Congo, Rep.Costa RicaCote d'IvoireCroatiaCubaCuracaoCyprusCzech RepublicDenmarkDominican RepublicEarly-demographic dividendEast Asia & PacificEast Asia & Pacific (excluding high income)East Asia & Pacific (IDA & IBRD countries)EcuadorEgypt, Arab Rep.El SalvadorEritreaEstoniaEthiopiaEuro areaEurope & Central AsiaEurope & Central Asia (excluding high income)Europe & Central Asia (IDA & IBRD countries)European UnionFinlandFragile and conflict affected situationsFranceGabonGeorgiaGermanyGhanaGibraltarGreeceGuatemalaHaitiHeavily indebted poor countries (HIPC)High incomeHondurasHong Kong SAR, ChinaHungaryIBRD onlyIcelandIDA & IBRD totalIDA blendIDA onlyIDA totalIndiaIndonesiaIran, Islamic Rep.IraqIrelandIsraelItalyJamaicaJapanJordanKazakhstanKenyaKorea, Dem. People’s Rep.Korea, Rep.KosovoKuwaitKyrgyz RepublicLate-demographic dividendLatin America & Caribbean Latin America & Caribbean (excluding high income)Latin America & the Caribbean (IDA & IBRD countries)LatviaLeast developed countries: UN classificationLebanonLibyaLithuaniaLow & middle incomeLow incomeLower middle incomeLuxembourgMacedonia, FYRMalaysiaMaltaMauritiusMexicoMiddle East & North AfricaMiddle East & North Africa (excluding high income)Middle East & North Africa (IDA & IBRD countries)Middle incomeMoldovaMongoliaMontenegroMoroccoMozambiqueMyanmarNamibiaNepalNetherlandsNew ZealandNicaraguaNigerNigeriaNorth AmericaNorwayOECD membersOmanOther small statesPakistanPanamaParaguayPeruPhilippinesPolandPortugalPost-demographic dividendPre-demographic dividendQatarRomaniaRussian FederationSaudi ArabiaSenegalSerbiaSingaporeSlovak RepublicSloveniaSmall statesSouth AfricaSouth AsiaSouth Asia (IDA & IBRD)South SudanSpainSri LankaSub-Saharan Africa Sub-Saharan Africa (excluding high income)Sub-Saharan Africa (IDA & IBRD countries)SudanSwedenSwitzerlandSyrian Arab RepublicTajikistanTanzaniaThailandTogoTrinidad and TobagoTunisiaTurkeyTurkmenistanUkraineUnited Arab EmiratesUnited KingdomUnited StatesUpper middle incomeUruguayUzbekistanVenezuela, RBVietnamWorldYemen, Rep.ZambiaZimbabwe Timeline:
This timeline shows a graph from 1961 to 2015 of Australia. No data until 1960. Number of actual observations by date: 55.
Source name:
World Development Indicators
Source organization:
IEA Statistics © OECD/IEA 2014 (http://www.iea.org/stats/index.asp), subject to https://www.iea.org/t&c/termsandconditions/
Categories, topics:
Energy & Mining, Trade
Last updated:
apr 23, 2017
Indicators value changes by year
Minimum:
-184.957
jan 1, 2015
Maximum:
34.466
jan 1, 1964
At the date of observation
Value
Absolute change
Change from previous value
jan 1, 1961
32.325
+32.325
0.0%
jan 1, 1962
30.98
-1.345
-4.16%
jan 1, 1963
32.836
+1.856
5.99%
jan 1, 1964
34.466
+1.63
4.96%
jan 1, 1965
32.197
-2.269
-6.58%
jan 1, 1966
28.269
-3.927
-12.2%
jan 1, 1967
28.424
+0.155
0.55%
jan 1, 1968
28.339
-0.085
-0.3%
jan 1, 1969
21.959
-6.38
-22.51%
jan 1, 1970
16.783
-5.176
-23.57%
jan 1, 1971
6.15
-10.634
-63.36%
jan 1, 1972
-4.336
-10.485
-170.5%
jan 1, 1973
-17.408
-13.072
301.51%
jan 1, 1974
-19.157
-1.749
10.05%
jan 1, 1975
-14.548
+4.609
-24.06%
jan 1, 1976
-24.154
-9.606
66.03%
jan 1, 1977
-21.716
+2.438
-10.09%
jan 1, 1978
-24.063
-2.347
10.81%
jan 1, 1979
-22.796
+1.267
-5.26%
jan 1, 1980
-27.275
-4.479
19.65%
jan 1, 1981
-22.712
+4.563
-16.73%
jan 1, 1982
-38.698
-15.986
70.38%
jan 1, 1983
-34.865
+3.833
-9.91%
jan 1, 1984
-53.479
-18.615
53.39%
jan 1, 1985
-63.693
-10.214
19.1%
jan 1, 1986
-76.555
-12.862
20.19%
jan 1, 1987
-84.257
-7.702
10.06%
jan 1, 1988
-91.83
-7.573
8.99%
jan 1, 1989
-75.863
+15.967
-17.39%
jan 1, 1990
-72.074
+3.789
-4.99%
jan 1, 1991
-82.37
-10.296
14.29%
jan 1, 1992
-96.086
-13.715
16.65%
jan 1, 1993
-98.397
-2.311
2.41%
jan 1, 1994
-92.355
+6.042
-6.14%
jan 1, 1995
-90.875
+1.48
-1.6%
jan 1, 1996
-101.625
-10.751
11.83%
jan 1, 1997
-92.133
+9.492
-9.34%
jan 1, 1998
-98.473
-6.34
6.88%
jan 1, 1999
-108.327
-9.854
10.01%
jan 1, 2000
-101.109
+7.218
-6.66%
jan 1, 2001
-116.051
-14.942
14.78%
jan 1, 2002
-135.646
-19.595
16.88%
jan 1, 2003
-132.127
+3.518
-2.59%
jan 1, 2004
-127.826
+4.301
-3.26%
jan 1, 2005
-125.597
+2.229
-1.74%
jan 1, 2006
-133.666
-8.069
6.42%
jan 1, 2007
-128.35
+5.316
-3.98%
jan 1, 2008
-134.1
-5.75
4.48%
jan 1, 2009
-126.273
+7.827
-5.84%
jan 1, 2010
-132.236
-5.963
4.72%
jan 1, 2011
-149.685
-17.448
13.19%
jan 1, 2012
-137.839
+11.846
-7.91%
jan 1, 2013
-149.941
-12.101
8.78%
jan 1, 2014
-166.3
-16.359
10.91%
jan 1, 2015
-184.957
-18.657
11.22%
Ranking of countries by current statistics by years


Comments: