29
/
en
AIzaSyAYiBZKx7MnpbEhh9jyipgxe19OcubqV5w
April 1, 2024
24829
Caribbean small states
CSS
false
2
1
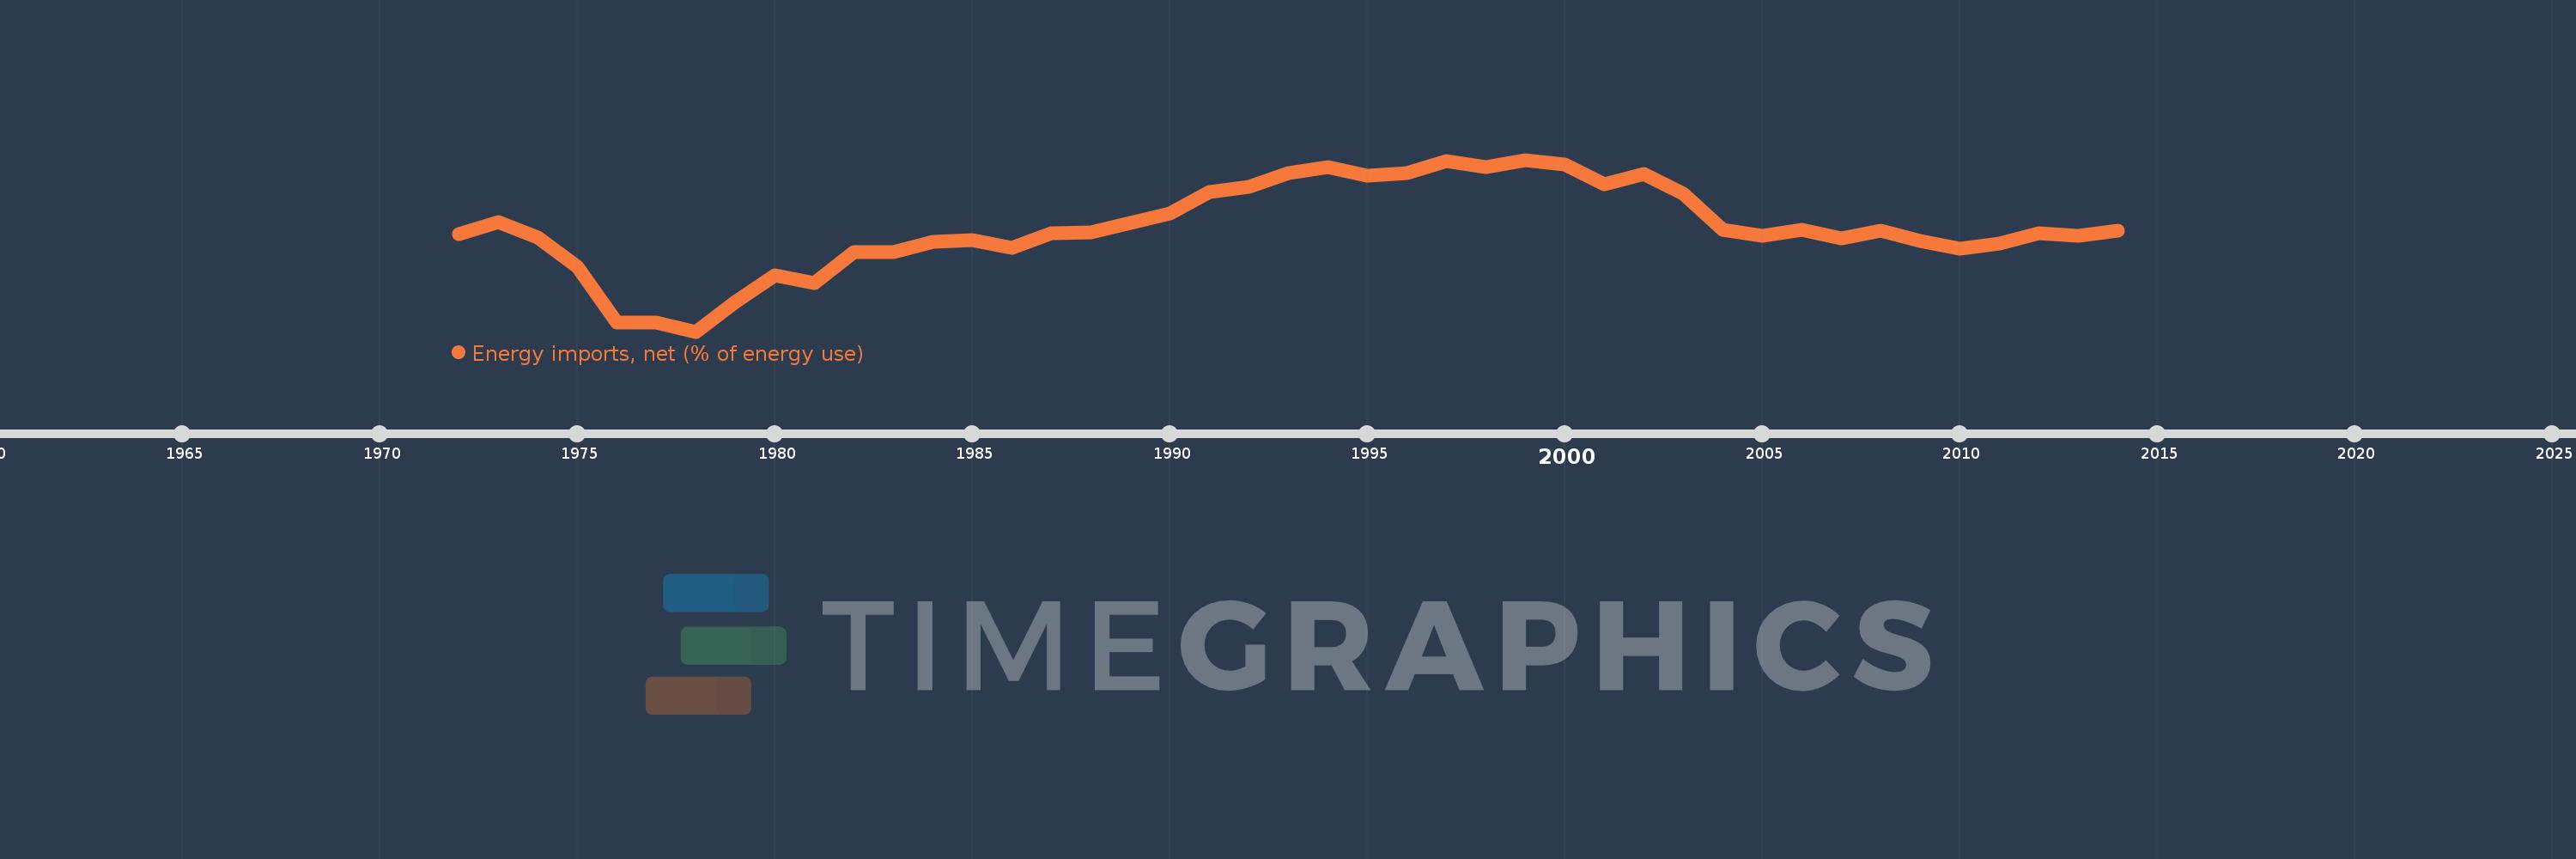
Energy imports, net (% of energy use)
2014,2013,2012,2011,2010,2009,2008,2007,2006,2005,2004,2003,2002,2001,2000,1999,1998,1997,1996,1995,1994,1993,1992,1991,1990,1989,1988,1987,1986,1985,1984,1983,1982,1981,1980,1979,1978,1977,1976,1975,1974,1973,1972
This statistics in other country:
AlbaniaAlgeriaAngolaArab WorldArgentinaArmeniaAustraliaAustriaAzerbaijanBahrainBangladeshBelarusBelgiumBeninBoliviaBosnia and HerzegovinaBotswanaBrazilBrunei DarussalamBulgariaCambodiaCameroonCanadaCaribbean small statesCentral Europe and the BalticsChileChinaColombiaCongo, Dem. Rep.Congo, Rep.Costa RicaCote d'IvoireCroatiaCubaCuracaoCyprusCzech RepublicDenmarkDominican RepublicEarly-demographic dividendEast Asia & PacificEast Asia & Pacific (excluding high income)East Asia & Pacific (IDA & IBRD countries)EcuadorEgypt, Arab Rep.El SalvadorEritreaEstoniaEthiopiaEuro areaEurope & Central AsiaEurope & Central Asia (excluding high income)Europe & Central Asia (IDA & IBRD countries)European UnionFinlandFragile and conflict affected situationsFranceGabonGeorgiaGermanyGhanaGibraltarGreeceGuatemalaHaitiHeavily indebted poor countries (HIPC)High incomeHondurasHong Kong SAR, ChinaHungaryIBRD onlyIcelandIDA & IBRD totalIDA blendIDA onlyIDA totalIndiaIndonesiaIran, Islamic Rep.IraqIrelandIsraelItalyJamaicaJapanJordanKazakhstanKenyaKorea, Dem. People’s Rep.Korea, Rep.KosovoKuwaitKyrgyz RepublicLate-demographic dividendLatin America & Caribbean Latin America & Caribbean (excluding high income)Latin America & the Caribbean (IDA & IBRD countries)LatviaLeast developed countries: UN classificationLebanonLibyaLithuaniaLow & middle incomeLow incomeLower middle incomeLuxembourgMacedonia, FYRMalaysiaMaltaMauritiusMexicoMiddle East & North AfricaMiddle East & North Africa (excluding high income)Middle East & North Africa (IDA & IBRD countries)Middle incomeMoldovaMongoliaMontenegroMoroccoMozambiqueMyanmarNamibiaNepalNetherlandsNew ZealandNicaraguaNigerNigeriaNorth AmericaNorwayOECD membersOmanOther small statesPakistanPanamaParaguayPeruPhilippinesPolandPortugalPost-demographic dividendPre-demographic dividendQatarRomaniaRussian FederationSaudi ArabiaSenegalSerbiaSingaporeSlovak RepublicSloveniaSmall statesSouth AfricaSouth AsiaSouth Asia (IDA & IBRD)South SudanSpainSri LankaSub-Saharan Africa Sub-Saharan Africa (excluding high income)Sub-Saharan Africa (IDA & IBRD countries)SudanSwedenSwitzerlandSyrian Arab RepublicTajikistanTanzaniaThailandTogoTrinidad and TobagoTunisiaTurkeyTurkmenistanUkraineUnited Arab EmiratesUnited KingdomUnited StatesUpper middle incomeUruguayUzbekistanVenezuela, RBVietnamWorldYemen, Rep.ZambiaZimbabwe Timeline:
This timeline shows a graph from 1972 to 2014 of Caribbean small states. No data until 1971. Number of actual observations by date: 43.
Source name:
World Development Indicators
Source organization:
IEA Statistics © OECD/IEA 2014 (http://www.iea.org/stats/index.asp), subject to https://www.iea.org/t&c/termsandconditions/
Categories, topics:
Energy & Mining, Trade
Last updated:
apr 23, 2017
Indicators value changes by year
Minimum:
-155.756
jan 1, 1978
Maximum:
-25.136
jan 1, 1999
At the date of observation
Value
Absolute change
Change from previous value
jan 1, 1972
-81.652
-81.652
0.0%
jan 1, 1973
-72.326
+9.326
-11.42%
jan 1, 1974
-84.166
-11.84
16.37%
jan 1, 1975
-106.357
-22.191
26.37%
jan 1, 1976
-148.974
-42.617
40.07%
jan 1, 1977
-149.207
-0.234
0.16%
jan 1, 1978
-155.756
-6.549
4.39%
jan 1, 1979
-132.915
+22.841
-14.66%
jan 1, 1980
-113.193
+19.722
-14.84%
jan 1, 1981
-119.127
-5.934
5.24%
jan 1, 1982
-95.068
+24.059
-20.2%
jan 1, 1983
-95.08
-0.012
0.01%
jan 1, 1984
-87.265
+7.815
-8.22%
jan 1, 1985
-86.486
+0.779
-0.89%
jan 1, 1986
-92.006
-5.52
6.38%
jan 1, 1987
-81.161
+10.845
-11.79%
jan 1, 1988
-80.481
+0.68
-0.84%
jan 1, 1989
-73.437
+7.043
-8.75%
jan 1, 1990
-65.875
+7.562
-10.3%
jan 1, 1991
-49.497
+16.378
-24.86%
jan 1, 1992
-45.562
+3.935
-7.95%
jan 1, 1993
-35.535
+10.028
-22.01%
jan 1, 1994
-30.892
+4.642
-13.06%
jan 1, 1995
-37.19
-6.298
20.39%
jan 1, 1996
-35.478
+1.712
-4.6%
jan 1, 1997
-25.948
+9.529
-26.86%
jan 1, 1998
-30.783
-4.835
18.63%
jan 1, 1999
-25.136
+5.647
-18.35%
jan 1, 2000
-28.426
-3.29
13.09%
jan 1, 2001
-43.541
-15.115
53.17%
jan 1, 2002
-35.975
+7.566
-17.38%
jan 1, 2003
-50.723
-14.748
41.0%
jan 1, 2004
-78.557
-27.834
54.87%
jan 1, 2005
-83.191
-4.634
5.9%
jan 1, 2006
-78.11
+5.081
-6.11%
jan 1, 2007
-84.999
-6.889
8.82%
jan 1, 2008
-78.706
+6.294
-7.4%
jan 1, 2009
-87.176
-8.471
10.76%
jan 1, 2010
-92.838
-5.662
6.5%
jan 1, 2011
-88.98
+3.858
-4.16%
jan 1, 2012
-81.02
+7.96
-8.95%
jan 1, 2013
-82.77
-1.75
2.16%
jan 1, 2014
-79.261
+3.509
-4.24%
Ranking of countries by current statistics by years


Comments: