29
/
en
AIzaSyAYiBZKx7MnpbEhh9jyipgxe19OcubqV5w
April 1, 2024
112155
Costa Rica
CRI
true
2
1
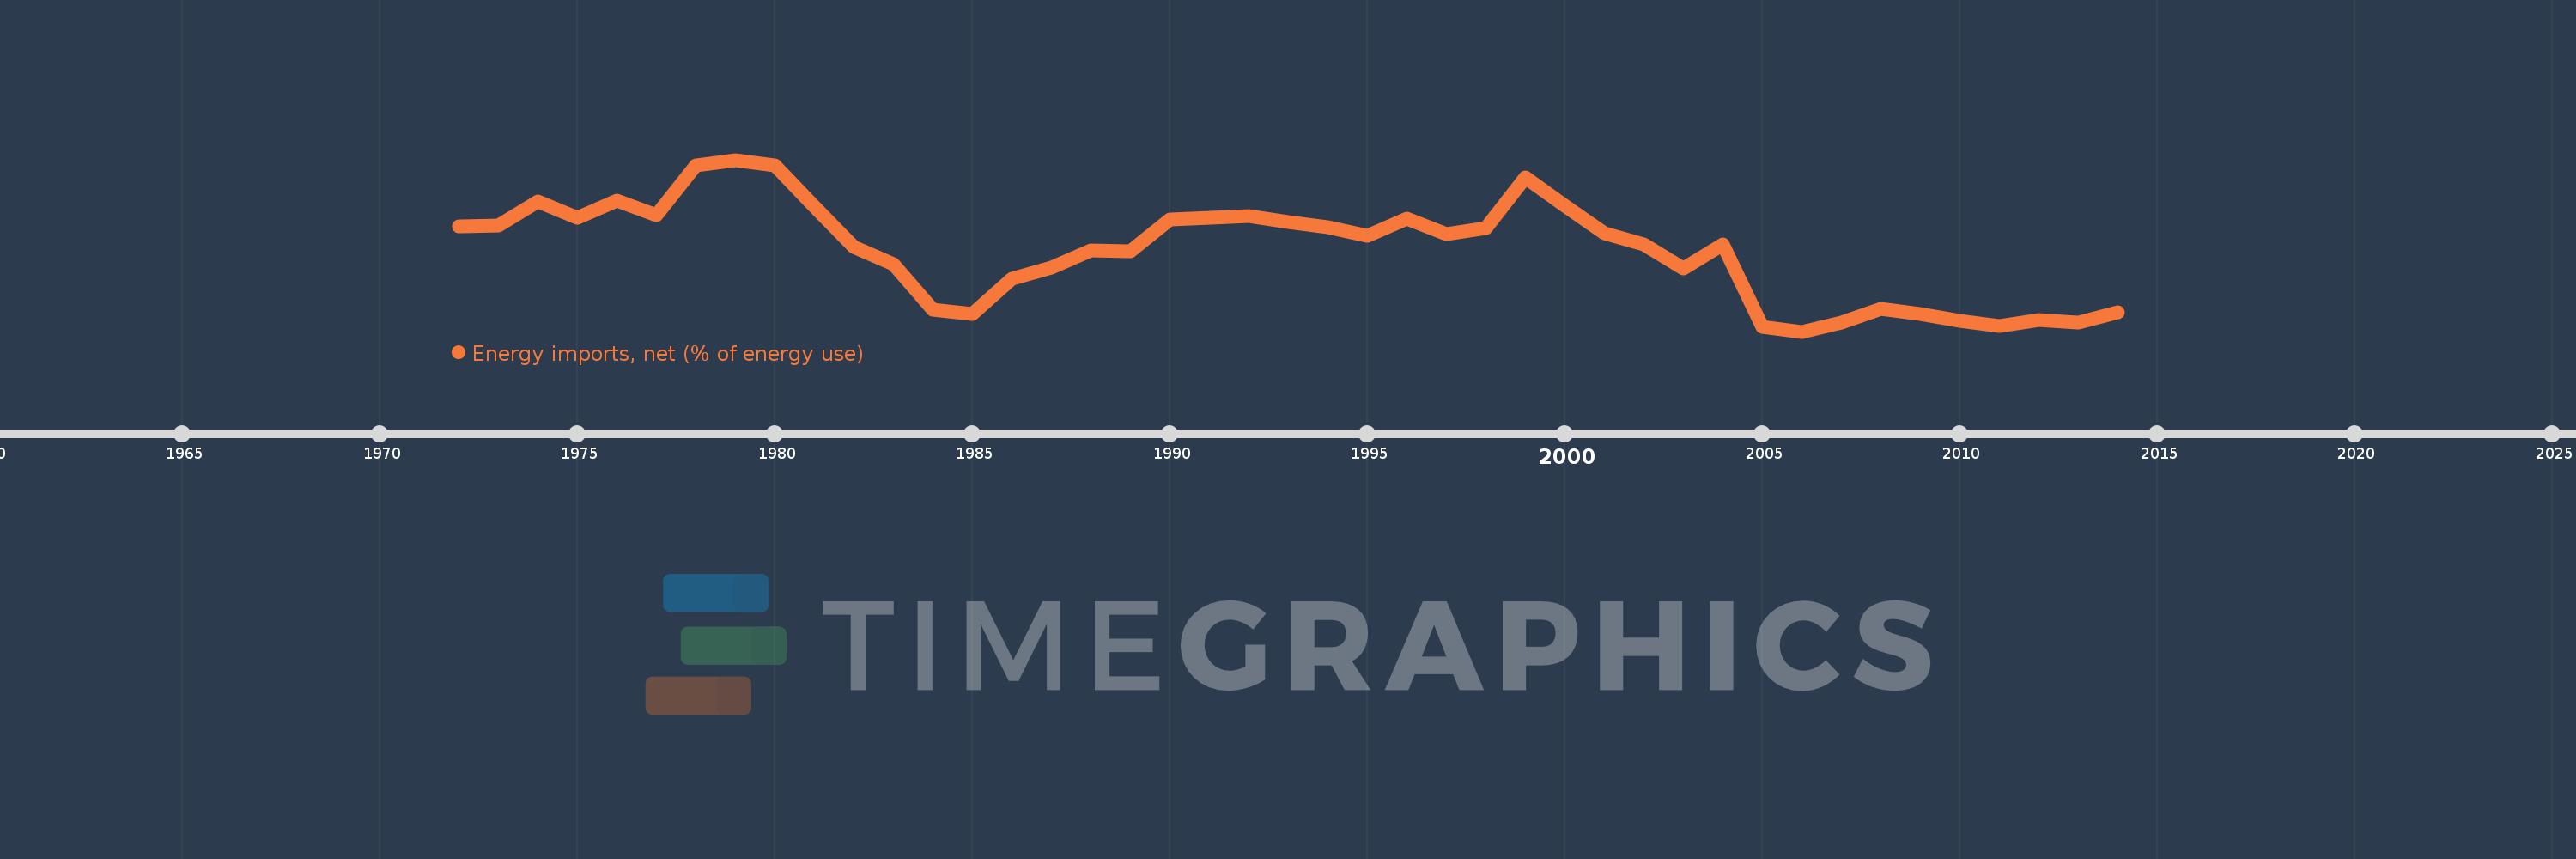
Energy imports, net (% of energy use)
2014,2013,2012,2011,2010,2009,2008,2007,2006,2005,2004,2003,2002,2001,2000,1999,1998,1997,1996,1995,1994,1993,1992,1991,1990,1989,1988,1987,1986,1985,1984,1983,1982,1981,1980,1979,1978,1977,1976,1975,1974,1973,1972
This statistics in other country:
AlbaniaAlgeriaAngolaArab WorldArgentinaArmeniaAustraliaAustriaAzerbaijanBahrainBangladeshBelarusBelgiumBeninBoliviaBosnia and HerzegovinaBotswanaBrazilBrunei DarussalamBulgariaCambodiaCameroonCanadaCaribbean small statesCentral Europe and the BalticsChileChinaColombiaCongo, Dem. Rep.Congo, Rep.Costa RicaCote d'IvoireCroatiaCubaCuracaoCyprusCzech RepublicDenmarkDominican RepublicEarly-demographic dividendEast Asia & PacificEast Asia & Pacific (excluding high income)East Asia & Pacific (IDA & IBRD countries)EcuadorEgypt, Arab Rep.El SalvadorEritreaEstoniaEthiopiaEuro areaEurope & Central AsiaEurope & Central Asia (excluding high income)Europe & Central Asia (IDA & IBRD countries)European UnionFinlandFragile and conflict affected situationsFranceGabonGeorgiaGermanyGhanaGibraltarGreeceGuatemalaHaitiHeavily indebted poor countries (HIPC)High incomeHondurasHong Kong SAR, ChinaHungaryIBRD onlyIcelandIDA & IBRD totalIDA blendIDA onlyIDA totalIndiaIndonesiaIran, Islamic Rep.IraqIrelandIsraelItalyJamaicaJapanJordanKazakhstanKenyaKorea, Dem. People’s Rep.Korea, Rep.KosovoKuwaitKyrgyz RepublicLate-demographic dividendLatin America & Caribbean Latin America & Caribbean (excluding high income)Latin America & the Caribbean (IDA & IBRD countries)LatviaLeast developed countries: UN classificationLebanonLibyaLithuaniaLow & middle incomeLow incomeLower middle incomeLuxembourgMacedonia, FYRMalaysiaMaltaMauritiusMexicoMiddle East & North AfricaMiddle East & North Africa (excluding high income)Middle East & North Africa (IDA & IBRD countries)Middle incomeMoldovaMongoliaMontenegroMoroccoMozambiqueMyanmarNamibiaNepalNetherlandsNew ZealandNicaraguaNigerNigeriaNorth AmericaNorwayOECD membersOmanOther small statesPakistanPanamaParaguayPeruPhilippinesPolandPortugalPost-demographic dividendPre-demographic dividendQatarRomaniaRussian FederationSaudi ArabiaSenegalSerbiaSingaporeSlovak RepublicSloveniaSmall statesSouth AfricaSouth AsiaSouth Asia (IDA & IBRD)South SudanSpainSri LankaSub-Saharan Africa Sub-Saharan Africa (excluding high income)Sub-Saharan Africa (IDA & IBRD countries)SudanSwedenSwitzerlandSyrian Arab RepublicTajikistanTanzaniaThailandTogoTrinidad and TobagoTunisiaTurkeyTurkmenistanUkraineUnited Arab EmiratesUnited KingdomUnited StatesUpper middle incomeUruguayUzbekistanVenezuela, RBVietnamWorldYemen, Rep.ZambiaZimbabwe Timeline:
This timeline shows a graph from 1972 to 2014 of Costa Rica. No data until 1971. Number of actual observations by date: 43.
Source name:
World Development Indicators
Source organization:
IEA Statistics © OECD/IEA 2014 (http://www.iea.org/stats/index.asp), subject to https://www.iea.org/t&c/termsandconditions/
Categories, topics:
Energy & Mining, Trade
Last updated:
apr 23, 2017
Indicators value changes by year
Minimum:
46.915
jan 1, 2006
Maximum:
65.643
jan 1, 1979
At the date of observation
Value
Absolute change
Change from previous value
jan 1, 1972
58.363
+58.363
0.0%
jan 1, 1973
58.524
+0.161
0.28%
jan 1, 1974
61.099
+2.574
4.4%
jan 1, 1975
59.334
-1.764
-2.89%
jan 1, 1976
61.239
+1.905
3.21%
jan 1, 1977
59.57
-1.669
-2.73%
jan 1, 1978
65.046
+5.475
9.19%
jan 1, 1979
65.643
+0.597
0.92%
jan 1, 1980
65.004
-0.639
-0.97%
jan 1, 1981
60.56
-4.444
-6.84%
jan 1, 1982
56.184
-4.376
-7.23%
jan 1, 1983
54.23
-1.954
-3.48%
jan 1, 1984
49.288
-4.942
-9.11%
jan 1, 1985
48.843
-0.445
-0.9%
jan 1, 1986
52.665
+3.821
7.82%
jan 1, 1987
53.862
+1.197
2.27%
jan 1, 1988
55.739
+1.877
3.49%
jan 1, 1989
55.675
-0.064
-0.12%
jan 1, 1990
59.134
+3.459
6.21%
jan 1, 1991
59.338
+0.204
0.34%
jan 1, 1992
59.489
+0.151
0.26%
jan 1, 1993
58.858
-0.631
-1.06%
jan 1, 1994
58.303
-0.555
-0.94%
jan 1, 1995
57.375
-0.928
-1.59%
jan 1, 1996
59.224
+1.85
3.22%
jan 1, 1997
57.572
-1.652
-2.79%
jan 1, 1998
58.178
+0.605
1.05%
jan 1, 1999
63.758
+5.58
9.59%
jan 1, 2000
60.59
-3.168
-4.97%
jan 1, 2001
57.606
-2.985
-4.93%
jan 1, 2002
56.433
-1.172
-2.04%
jan 1, 2003
53.801
-2.632
-4.66%
jan 1, 2004
56.387
+2.586
4.81%
jan 1, 2005
47.464
-8.923
-15.82%
jan 1, 2006
46.915
-0.548
-1.15%
jan 1, 2007
47.903
+0.988
2.11%
jan 1, 2008
49.375
+1.472
3.07%
jan 1, 2009
48.867
-0.508
-1.03%
jan 1, 2010
48.103
-0.764
-1.56%
jan 1, 2011
47.57
-0.533
-1.11%
jan 1, 2012
48.196
+0.627
1.32%
jan 1, 2013
47.86
-0.336
-0.7%
jan 1, 2014
49.05
+1.19
2.49%
Ranking of countries by current statistics by years


Comments: