29
/
en
AIzaSyAYiBZKx7MnpbEhh9jyipgxe19OcubqV5w
April 1, 2024
234570
Saudi Arabia
SAU
true
2
1
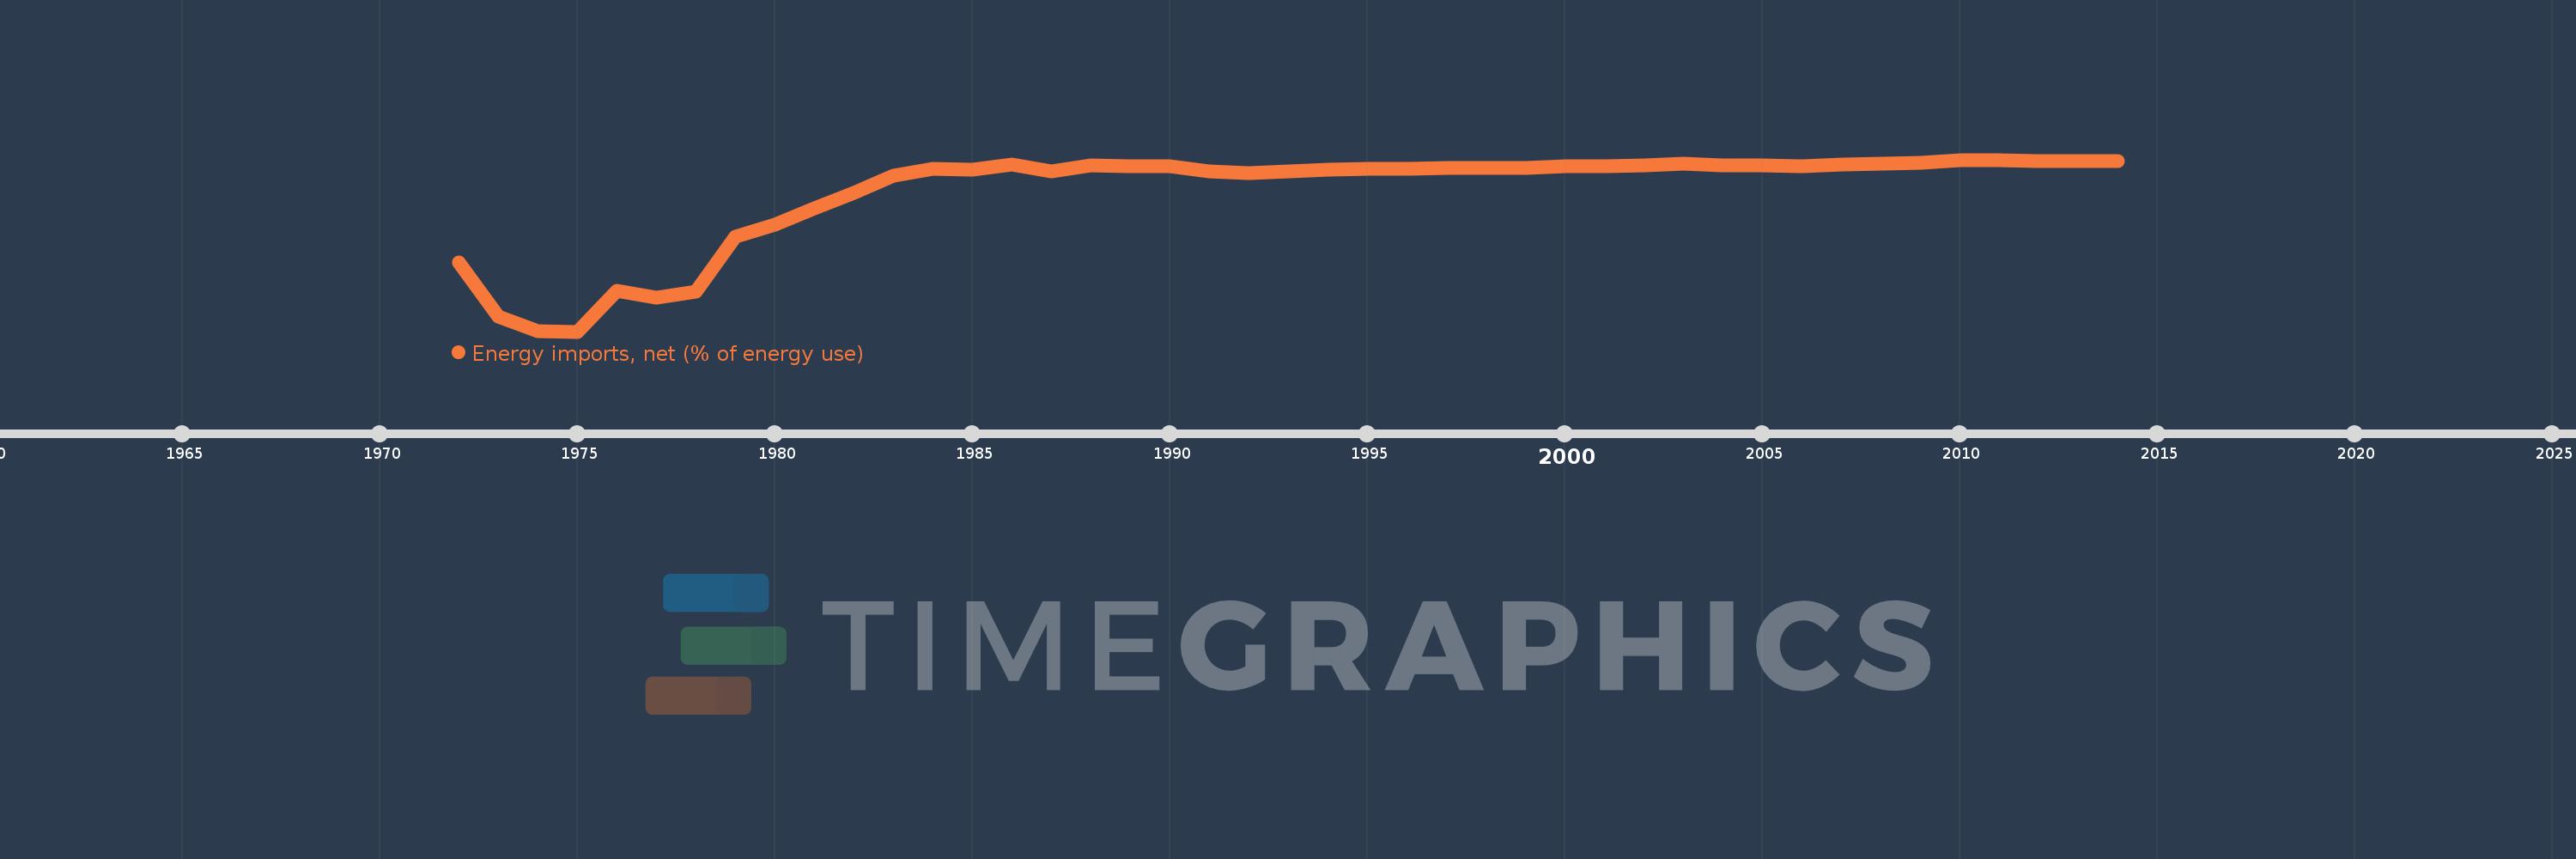
Energy imports, net (% of energy use)
2014,2013,2012,2011,2010,2009,2008,2007,2006,2005,2004,2003,2002,2001,2000,1999,1998,1997,1996,1995,1994,1993,1992,1991,1990,1989,1988,1987,1986,1985,1984,1983,1982,1981,1980,1979,1978,1977,1976,1975,1974,1973,1972
This statistics in other country:
AlbaniaAlgeriaAngolaArab WorldArgentinaArmeniaAustraliaAustriaAzerbaijanBahrainBangladeshBelarusBelgiumBeninBoliviaBosnia and HerzegovinaBotswanaBrazilBrunei DarussalamBulgariaCambodiaCameroonCanadaCaribbean small statesCentral Europe and the BalticsChileChinaColombiaCongo, Dem. Rep.Congo, Rep.Costa RicaCote d'IvoireCroatiaCubaCuracaoCyprusCzech RepublicDenmarkDominican RepublicEarly-demographic dividendEast Asia & PacificEast Asia & Pacific (excluding high income)East Asia & Pacific (IDA & IBRD countries)EcuadorEgypt, Arab Rep.El SalvadorEritreaEstoniaEthiopiaEuro areaEurope & Central AsiaEurope & Central Asia (excluding high income)Europe & Central Asia (IDA & IBRD countries)European UnionFinlandFragile and conflict affected situationsFranceGabonGeorgiaGermanyGhanaGibraltarGreeceGuatemalaHaitiHeavily indebted poor countries (HIPC)High incomeHondurasHong Kong SAR, ChinaHungaryIBRD onlyIcelandIDA & IBRD totalIDA blendIDA onlyIDA totalIndiaIndonesiaIran, Islamic Rep.IraqIrelandIsraelItalyJamaicaJapanJordanKazakhstanKenyaKorea, Dem. People’s Rep.Korea, Rep.KosovoKuwaitKyrgyz RepublicLate-demographic dividendLatin America & Caribbean Latin America & Caribbean (excluding high income)Latin America & the Caribbean (IDA & IBRD countries)LatviaLeast developed countries: UN classificationLebanonLibyaLithuaniaLow & middle incomeLow incomeLower middle incomeLuxembourgMacedonia, FYRMalaysiaMaltaMauritiusMexicoMiddle East & North AfricaMiddle East & North Africa (excluding high income)Middle East & North Africa (IDA & IBRD countries)Middle incomeMoldovaMongoliaMontenegroMoroccoMozambiqueMyanmarNamibiaNepalNetherlandsNew ZealandNicaraguaNigerNigeriaNorth AmericaNorwayOECD membersOmanOther small statesPakistanPanamaParaguayPeruPhilippinesPolandPortugalPost-demographic dividendPre-demographic dividendQatarRomaniaRussian FederationSaudi ArabiaSenegalSerbiaSingaporeSlovak RepublicSloveniaSmall statesSouth AfricaSouth AsiaSouth Asia (IDA & IBRD)South SudanSpainSri LankaSub-Saharan Africa Sub-Saharan Africa (excluding high income)Sub-Saharan Africa (IDA & IBRD countries)SudanSwedenSwitzerlandSyrian Arab RepublicTajikistanTanzaniaThailandTogoTrinidad and TobagoTunisiaTurkeyTurkmenistanUkraineUnited Arab EmiratesUnited KingdomUnited StatesUpper middle incomeUruguayUzbekistanVenezuela, RBVietnamWorldYemen, Rep.ZambiaZimbabwe Timeline:
This timeline shows a graph from 1972 to 2014 of Saudi Arabia. No data until 1971. Number of actual observations by date: 43.
Source name:
World Development Indicators
Source organization:
IEA Statistics © OECD/IEA 2014 (http://www.iea.org/stats/index.asp), subject to https://www.iea.org/t&c/termsandconditions/
Categories, topics:
Energy & Mining, Trade
Last updated:
apr 23, 2017
Indicators value changes by year
Minimum:
-5.272K
jan 1, 1975
Maximum:
-186.51
jan 1, 2011
At the date of observation
Value
Absolute change
Change from previous value
jan 1, 1972
-3.218K
-3.218K
0.0%
jan 1, 1973
-4.829K
-1.611K
50.06%
jan 1, 1974
-5.272K
-443.076
9.18%
jan 1, 1975
-5.272K
-0.506
0.01%
jan 1, 1976
-4.057K
+1.215K
-23.04%
jan 1, 1977
-4.266K
-208.806
5.15%
jan 1, 1978
-4.086K
+180.362
-4.23%
jan 1, 1979
-2.458K
+1.627K
-39.83%
jan 1, 1980
-2.116K
+342.842
-13.95%
jan 1, 1981
-1.616K
+499.725
-23.62%
jan 1, 1982
-1.155K
+460.554
-28.5%
jan 1, 1983
-662.138
+493.166
-42.69%
jan 1, 1984
-447.657
+214.481
-32.39%
jan 1, 1985
-478.327
-30.67
6.85%
jan 1, 1986
-336.431
+141.896
-29.67%
jan 1, 1987
-522.096
-185.665
55.19%
jan 1, 1988
-352.522
+169.574
-32.48%
jan 1, 1989
-373.198
-20.676
5.87%
jan 1, 1990
-376.349
-3.151
0.84%
jan 1, 1991
-535.188
-158.839
42.21%
jan 1, 1992
-586.682
-51.494
9.62%
jan 1, 1993
-520.327
+66.355
-11.31%
jan 1, 1994
-490.736
+29.592
-5.69%
jan 1, 1995
-449.632
+41.103
-8.38%
jan 1, 1996
-449.353
+0.28
-0.06%
jan 1, 1997
-418.536
+30.817
-6.86%
jan 1, 1998
-438.437
-19.901
4.75%
jan 1, 1999
-420.669
+17.767
-4.05%
jan 1, 2000
-372.668
+48.002
-11.41%
jan 1, 2001
-386.248
-13.58
3.64%
jan 1, 2002
-361.93
+24.318
-6.3%
jan 1, 2003
-290.774
+71.156
-19.66%
jan 1, 2004
-349.868
-59.094
20.32%
jan 1, 2005
-352.903
-3.034
0.87%
jan 1, 2006
-365.87
-12.968
3.67%
jan 1, 2007
-316.28
+49.591
-13.55%
jan 1, 2008
-289.452
+26.828
-8.48%
jan 1, 2009
-266.008
+23.443
-8.1%
jan 1, 2010
-211.609
+54.399
-20.45%
jan 1, 2011
-186.51
+25.099
-11.86%
jan 1, 2012
-232.737
-46.228
24.79%
jan 1, 2013
-211.956
+20.781
-8.93%
jan 1, 2014
-219.74
-7.783
3.67%
Ranking of countries by current statistics by years


Comments: