29
/
en
AIzaSyAYiBZKx7MnpbEhh9jyipgxe19OcubqV5w
April 1, 2024
33371
European Union
EUU
false
2
1
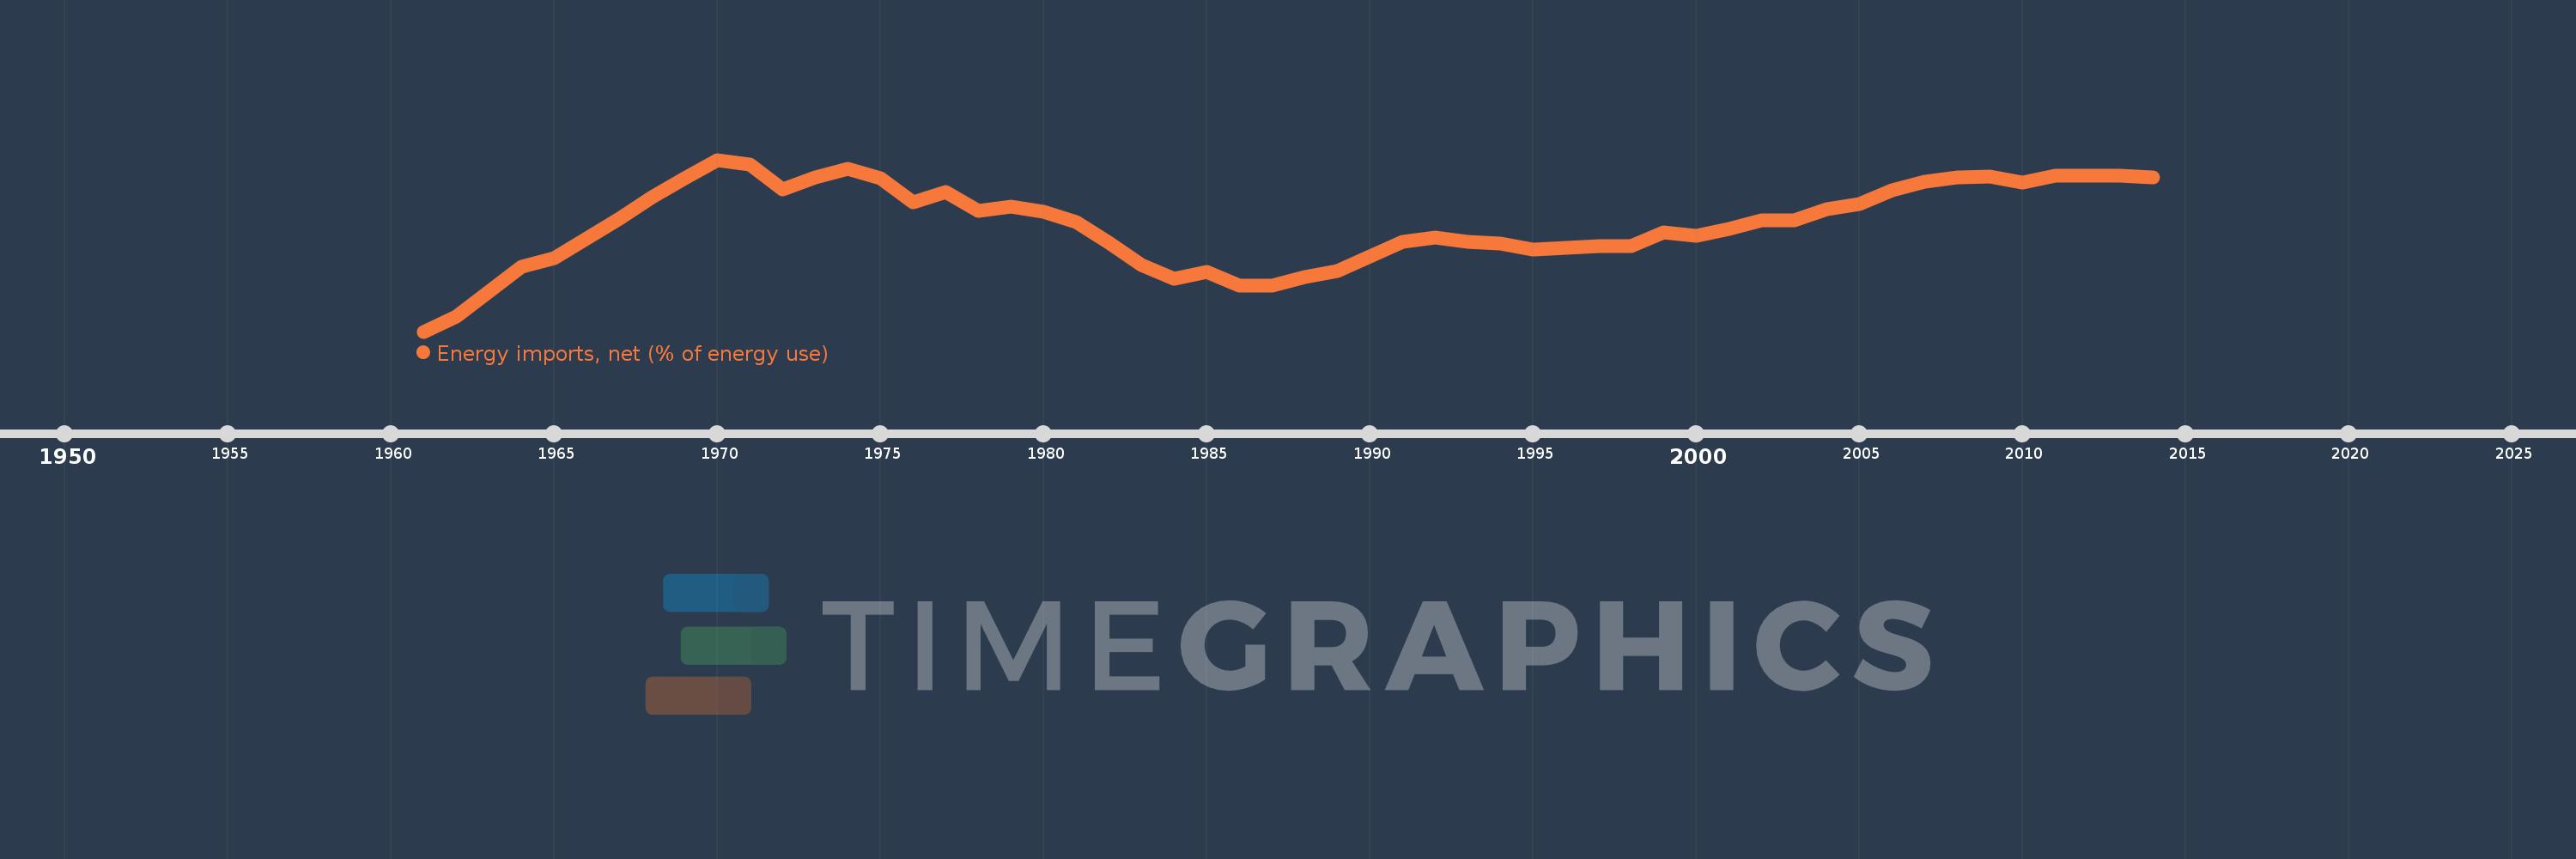
Energy imports, net (% of energy use)
2014,2013,2012,2011,2010,2009,2008,2007,2006,2005,2004,2003,2002,2001,2000,1999,1998,1997,1996,1995,1994,1993,1992,1991,1990,1989,1988,1987,1986,1985,1984,1983,1982,1981,1980,1979,1978,1977,1976,1975,1974,1973,1972,1971,1970,1969,1968,1967,1966,1965,1964,1963,1962,1961
This statistics in other country:
AlbaniaAlgeriaAngolaArab WorldArgentinaArmeniaAustraliaAustriaAzerbaijanBahrainBangladeshBelarusBelgiumBeninBoliviaBosnia and HerzegovinaBotswanaBrazilBrunei DarussalamBulgariaCambodiaCameroonCanadaCaribbean small statesCentral Europe and the BalticsChileChinaColombiaCongo, Dem. Rep.Congo, Rep.Costa RicaCote d'IvoireCroatiaCubaCuracaoCyprusCzech RepublicDenmarkDominican RepublicEarly-demographic dividendEast Asia & PacificEast Asia & Pacific (excluding high income)East Asia & Pacific (IDA & IBRD countries)EcuadorEgypt, Arab Rep.El SalvadorEritreaEstoniaEthiopiaEuro areaEurope & Central AsiaEurope & Central Asia (excluding high income)Europe & Central Asia (IDA & IBRD countries)European UnionFinlandFragile and conflict affected situationsFranceGabonGeorgiaGermanyGhanaGibraltarGreeceGuatemalaHaitiHeavily indebted poor countries (HIPC)High incomeHondurasHong Kong SAR, ChinaHungaryIBRD onlyIcelandIDA & IBRD totalIDA blendIDA onlyIDA totalIndiaIndonesiaIran, Islamic Rep.IraqIrelandIsraelItalyJamaicaJapanJordanKazakhstanKenyaKorea, Dem. People’s Rep.Korea, Rep.KosovoKuwaitKyrgyz RepublicLate-demographic dividendLatin America & Caribbean Latin America & Caribbean (excluding high income)Latin America & the Caribbean (IDA & IBRD countries)LatviaLeast developed countries: UN classificationLebanonLibyaLithuaniaLow & middle incomeLow incomeLower middle incomeLuxembourgMacedonia, FYRMalaysiaMaltaMauritiusMexicoMiddle East & North AfricaMiddle East & North Africa (excluding high income)Middle East & North Africa (IDA & IBRD countries)Middle incomeMoldovaMongoliaMontenegroMoroccoMozambiqueMyanmarNamibiaNepalNetherlandsNew ZealandNicaraguaNigerNigeriaNorth AmericaNorwayOECD membersOmanOther small statesPakistanPanamaParaguayPeruPhilippinesPolandPortugalPost-demographic dividendPre-demographic dividendQatarRomaniaRussian FederationSaudi ArabiaSenegalSerbiaSingaporeSlovak RepublicSloveniaSmall statesSouth AfricaSouth AsiaSouth Asia (IDA & IBRD)South SudanSpainSri LankaSub-Saharan Africa Sub-Saharan Africa (excluding high income)Sub-Saharan Africa (IDA & IBRD countries)SudanSwedenSwitzerlandSyrian Arab RepublicTajikistanTanzaniaThailandTogoTrinidad and TobagoTunisiaTurkeyTurkmenistanUkraineUnited Arab EmiratesUnited KingdomUnited StatesUpper middle incomeUruguayUzbekistanVenezuela, RBVietnamWorldYemen, Rep.ZambiaZimbabwe Timeline:
This timeline shows a graph from 1961 to 2014 of European Union. No data until 1960. Number of actual observations by date: 54.
Source name:
World Development Indicators
Source organization:
IEA Statistics © OECD/IEA 2014 (http://www.iea.org/stats/index.asp), subject to https://www.iea.org/t&c/termsandconditions/
Categories, topics:
Energy & Mining, Trade
Last updated:
apr 23, 2017
Indicators value changes by year
Minimum:
29.583
jan 1, 1961
Maximum:
53.654
jan 1, 1970
At the date of observation
Value
Absolute change
Change from previous value
jan 1, 1961
29.583
+29.583
0.0%
jan 1, 1962
31.64
+2.057
6.95%
jan 1, 1963
35.128
+3.488
11.03%
jan 1, 1964
38.665
+3.537
10.07%
jan 1, 1965
39.867
+1.203
3.11%
jan 1, 1966
42.655
+2.787
6.99%
jan 1, 1967
45.429
+2.774
6.5%
jan 1, 1968
48.454
+3.025
6.66%
jan 1, 1969
51.034
+2.581
5.33%
jan 1, 1970
53.654
+2.619
5.13%
jan 1, 1971
53.01
-0.643
-1.2%
jan 1, 1972
49.475
-3.535
-6.67%
jan 1, 1973
51.135
+1.66
3.36%
jan 1, 1974
52.416
+1.28
2.5%
jan 1, 1975
51.044
-1.372
-2.62%
jan 1, 1976
47.693
-3.351
-6.56%
jan 1, 1977
49.082
+1.388
2.91%
jan 1, 1978
46.534
-2.547
-5.19%
jan 1, 1979
47.079
+0.545
1.17%
jan 1, 1980
46.392
-0.688
-1.46%
jan 1, 1981
44.884
-1.507
-3.25%
jan 1, 1982
42.052
-2.832
-6.31%
jan 1, 1983
38.869
-3.183
-7.57%
jan 1, 1984
36.935
-1.934
-4.97%
jan 1, 1985
37.904
+0.969
2.62%
jan 1, 1986
35.976
-1.927
-5.09%
jan 1, 1987
36.002
+0.026
0.07%
jan 1, 1988
37.221
+1.219
3.39%
jan 1, 1989
38.063
+0.842
2.26%
jan 1, 1990
40.095
+2.032
5.34%
jan 1, 1991
42.208
+2.114
5.27%
jan 1, 1992
42.811
+0.603
1.43%
jan 1, 1993
42.147
-0.665
-1.55%
jan 1, 1994
41.861
-0.286
-0.68%
jan 1, 1995
41.053
-0.808
-1.93%
jan 1, 1996
41.305
+0.252
0.61%
jan 1, 1997
41.582
+0.277
0.67%
jan 1, 1998
41.516
-0.066
-0.16%
jan 1, 1999
43.477
+1.961
4.72%
jan 1, 2000
42.981
-0.496
-1.14%
jan 1, 2001
43.923
+0.941
2.19%
jan 1, 2002
45.198
+1.275
2.9%
jan 1, 2003
45.143
-0.055
-0.12%
jan 1, 2004
46.739
+1.596
3.54%
jan 1, 2005
47.504
+0.765
1.64%
jan 1, 2006
49.352
+1.847
3.89%
jan 1, 2007
50.598
+1.246
2.53%
jan 1, 2008
51.189
+0.59
1.17%
jan 1, 2009
51.3
+0.111
0.22%
jan 1, 2010
50.48
-0.82
-1.6%
jan 1, 2011
51.446
+0.967
1.92%
jan 1, 2012
51.439
-0.007
-0.01%
jan 1, 2013
51.408
-0.031
-0.06%
jan 1, 2014
51.207
-0.201
-0.39%
Ranking of countries by current statistics by years


Comments: