29
/
en
AIzaSyAYiBZKx7MnpbEhh9jyipgxe19OcubqV5w
April 1, 2024
195455
Mexico
MEX
true
2
1
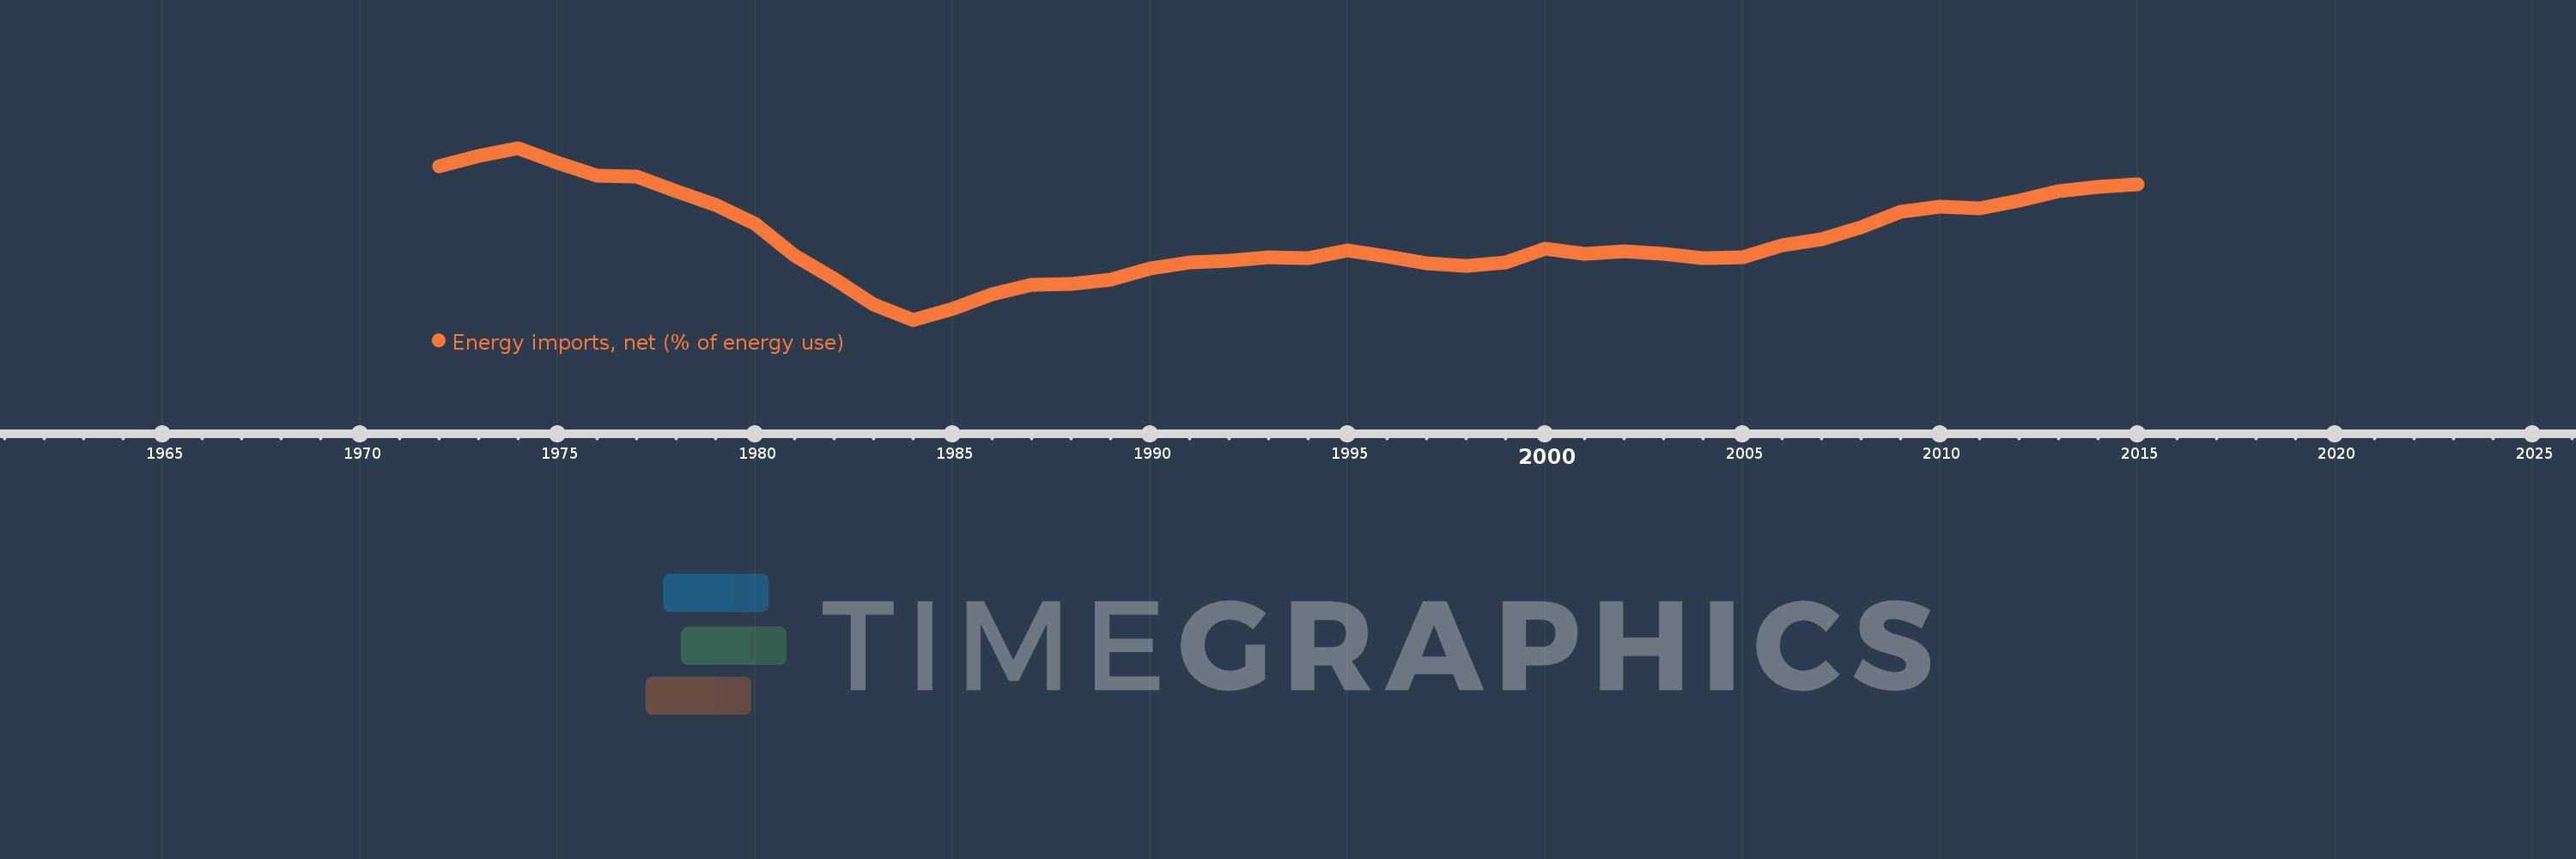
Energy imports, net (% of energy use)
2015,2014,2013,2012,2011,2010,2009,2008,2007,2006,2005,2004,2003,2002,2001,2000,1999,1998,1997,1996,1995,1994,1993,1992,1991,1990,1989,1988,1987,1986,1985,1984,1983,1982,1981,1980,1979,1978,1977,1976,1975,1974,1973,1972
This statistics in other country:
AlbaniaAlgeriaAngolaArab WorldArgentinaArmeniaAustraliaAustriaAzerbaijanBahrainBangladeshBelarusBelgiumBeninBoliviaBosnia and HerzegovinaBotswanaBrazilBrunei DarussalamBulgariaCambodiaCameroonCanadaCaribbean small statesCentral Europe and the BalticsChileChinaColombiaCongo, Dem. Rep.Congo, Rep.Costa RicaCote d'IvoireCroatiaCubaCuracaoCyprusCzech RepublicDenmarkDominican RepublicEarly-demographic dividendEast Asia & PacificEast Asia & Pacific (excluding high income)East Asia & Pacific (IDA & IBRD countries)EcuadorEgypt, Arab Rep.El SalvadorEritreaEstoniaEthiopiaEuro areaEurope & Central AsiaEurope & Central Asia (excluding high income)Europe & Central Asia (IDA & IBRD countries)European UnionFinlandFragile and conflict affected situationsFranceGabonGeorgiaGermanyGhanaGibraltarGreeceGuatemalaHaitiHeavily indebted poor countries (HIPC)High incomeHondurasHong Kong SAR, ChinaHungaryIBRD onlyIcelandIDA & IBRD totalIDA blendIDA onlyIDA totalIndiaIndonesiaIran, Islamic Rep.IraqIrelandIsraelItalyJamaicaJapanJordanKazakhstanKenyaKorea, Dem. People’s Rep.Korea, Rep.KosovoKuwaitKyrgyz RepublicLate-demographic dividendLatin America & Caribbean Latin America & Caribbean (excluding high income)Latin America & the Caribbean (IDA & IBRD countries)LatviaLeast developed countries: UN classificationLebanonLibyaLithuaniaLow & middle incomeLow incomeLower middle incomeLuxembourgMacedonia, FYRMalaysiaMaltaMauritiusMexicoMiddle East & North AfricaMiddle East & North Africa (excluding high income)Middle East & North Africa (IDA & IBRD countries)Middle incomeMoldovaMongoliaMontenegroMoroccoMozambiqueMyanmarNamibiaNepalNetherlandsNew ZealandNicaraguaNigerNigeriaNorth AmericaNorwayOECD membersOmanOther small statesPakistanPanamaParaguayPeruPhilippinesPolandPortugalPost-demographic dividendPre-demographic dividendQatarRomaniaRussian FederationSaudi ArabiaSenegalSerbiaSingaporeSlovak RepublicSloveniaSmall statesSouth AfricaSouth AsiaSouth Asia (IDA & IBRD)South SudanSpainSri LankaSub-Saharan Africa Sub-Saharan Africa (excluding high income)Sub-Saharan Africa (IDA & IBRD countries)SudanSwedenSwitzerlandSyrian Arab RepublicTajikistanTanzaniaThailandTogoTrinidad and TobagoTunisiaTurkeyTurkmenistanUkraineUnited Arab EmiratesUnited KingdomUnited StatesUpper middle incomeUruguayUzbekistanVenezuela, RBVietnamWorldYemen, Rep.ZambiaZimbabwe Timeline:
This timeline shows a graph from 1972 to 2015 of Mexico. No data until 1971. Number of actual observations by date: 44.
Source name:
World Development Indicators
Source organization:
IEA Statistics © OECD/IEA 2014 (http://www.iea.org/stats/index.asp), subject to https://www.iea.org/t&c/termsandconditions/
Categories, topics:
Energy & Mining, Trade
Last updated:
apr 23, 2017
Indicators value changes by year
Minimum:
-93.054
jan 1, 1984
Maximum:
10.055
jan 1, 1974
At the date of observation
Value
Absolute change
Change from previous value
jan 1, 1972
-0.88
-0.88
0.0%
jan 1, 1973
5.242
+6.122
-695.72%
jan 1, 1974
10.055
+4.813
91.83%
jan 1, 1975
1.282
-8.773
-87.25%
jan 1, 1976
-6.547
-7.829
-610.73%
jan 1, 1977
-7.283
-0.735
11.23%
jan 1, 1978
-15.629
-8.347
114.61%
jan 1, 1979
-24.141
-8.512
54.46%
jan 1, 1980
-35.292
-11.151
46.19%
jan 1, 1981
-54.586
-19.293
54.67%
jan 1, 1982
-68.604
-14.019
25.68%
jan 1, 1983
-84.026
-15.421
22.48%
jan 1, 1984
-93.054
-9.028
10.74%
jan 1, 1985
-86.641
+6.413
-6.89%
jan 1, 1986
-77.543
+9.098
-10.5%
jan 1, 1987
-72.321
+5.222
-6.73%
jan 1, 1988
-71.739
+0.582
-0.81%
jan 1, 1989
-68.949
+2.79
-3.89%
jan 1, 1990
-62.114
+6.835
-9.91%
jan 1, 1991
-58.898
+3.216
-5.18%
jan 1, 1992
-57.828
+1.07
-1.82%
jan 1, 1993
-55.78
+2.048
-3.54%
jan 1, 1994
-56.346
-0.566
1.01%
jan 1, 1995
-51.658
+4.688
-8.32%
jan 1, 1996
-55.122
-3.464
6.71%
jan 1, 1997
-59.42
-4.298
7.8%
jan 1, 1998
-60.681
-1.261
2.12%
jan 1, 1999
-58.48
+2.201
-3.63%
jan 1, 2000
-50.249
+8.231
-14.08%
jan 1, 2001
-53.379
-3.13
6.23%
jan 1, 2002
-52.093
+1.285
-2.41%
jan 1, 2003
-53.575
-1.481
2.84%
jan 1, 2004
-56.035
-2.461
4.59%
jan 1, 2005
-55.724
+0.311
-0.56%
jan 1, 2006
-48.121
+7.603
-13.64%
jan 1, 2007
-44.748
+3.373
-7.01%
jan 1, 2008
-37.614
+7.133
-15.94%
jan 1, 2009
-28.034
+9.58
-25.47%
jan 1, 2010
-25.169
+2.865
-10.22%
jan 1, 2011
-26.05
-0.881
3.5%
jan 1, 2012
-21.35
+4.7
-18.04%
jan 1, 2013
-16.073
+5.277
-24.72%
jan 1, 2014
-13.191
+2.882
-17.93%
jan 1, 2015
-11.726
+1.465
-11.1%
Ranking of countries by current statistics by years


Comments: