29
/
en
AIzaSyAYiBZKx7MnpbEhh9jyipgxe19OcubqV5w
April 1, 2024
51800
North America
NAC
false
2
1
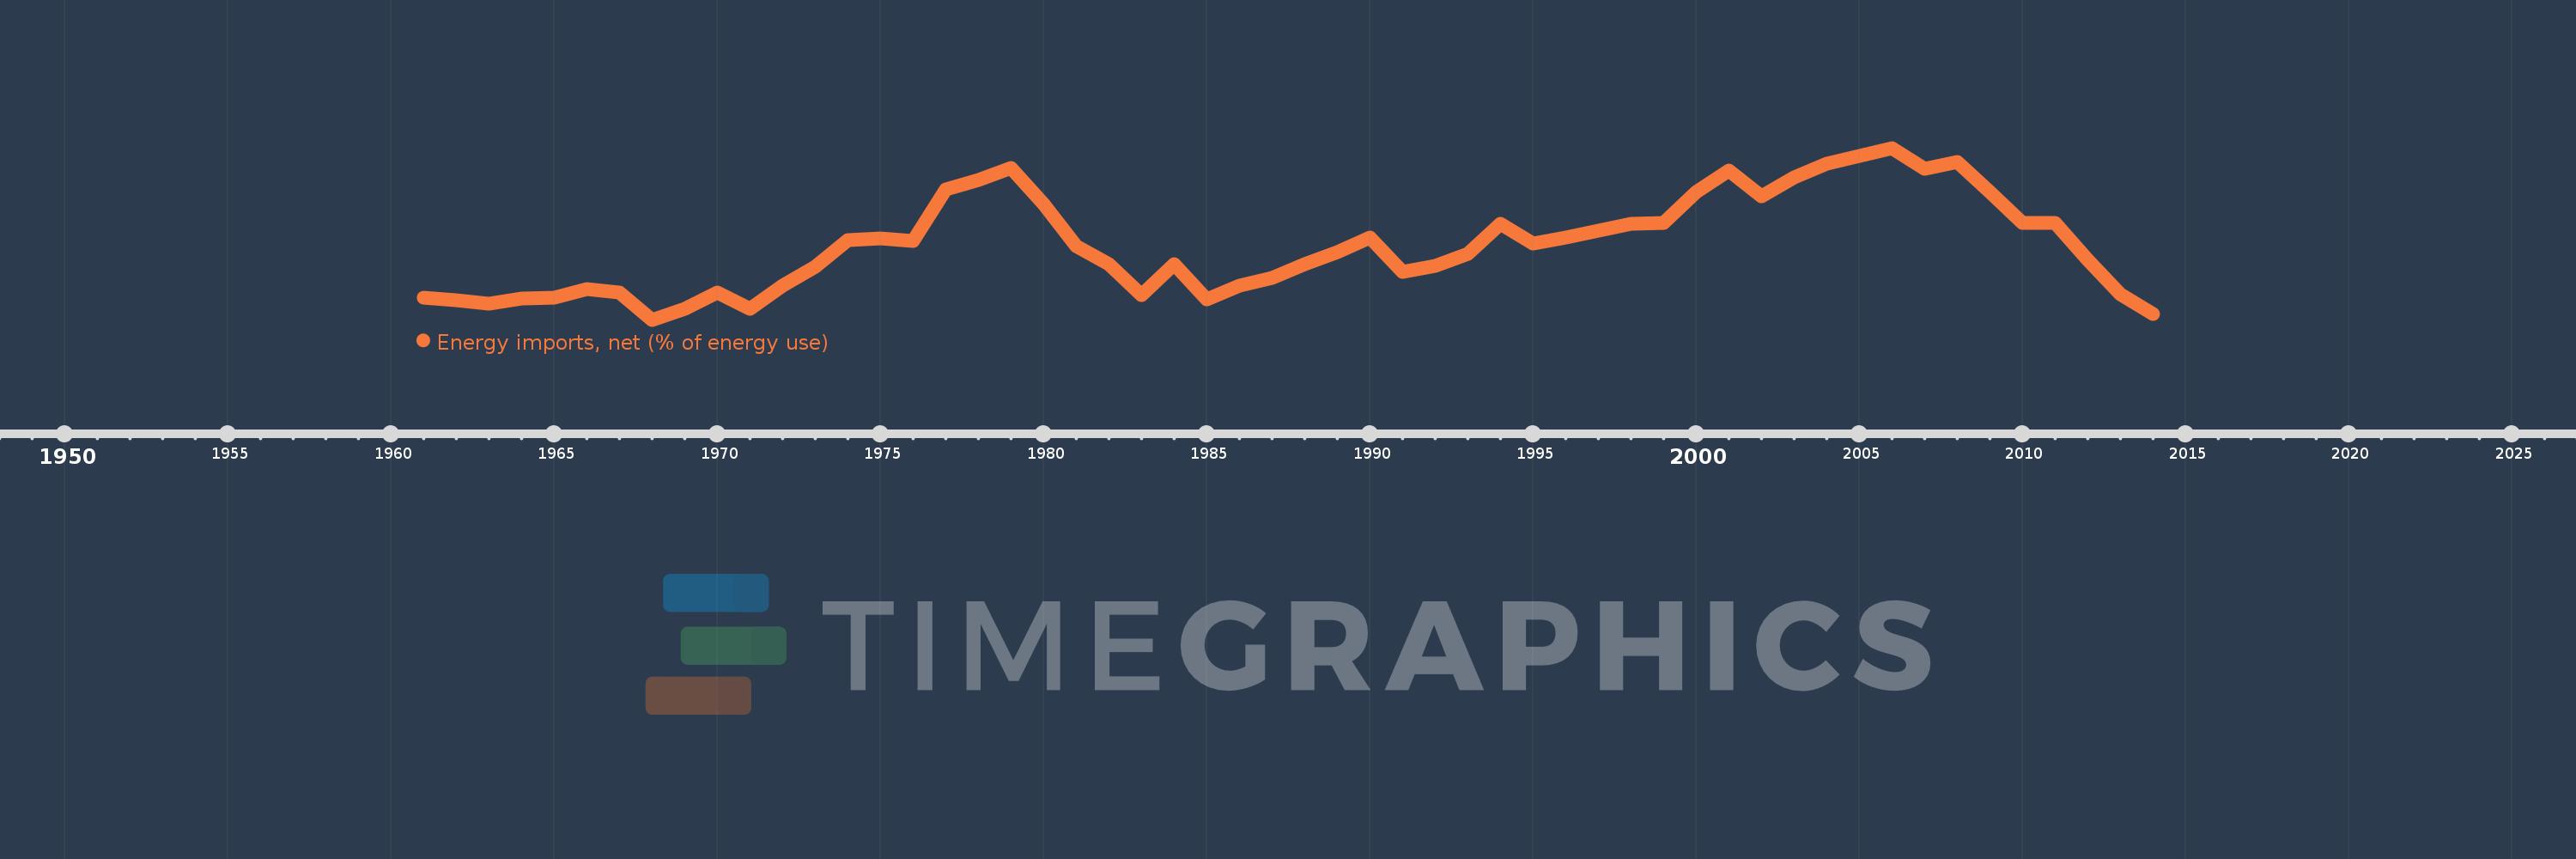
Energy imports, net (% of energy use)
2014,2013,2012,2011,2010,2009,2008,2007,2006,2005,2004,2003,2002,2001,2000,1999,1998,1997,1996,1995,1994,1993,1992,1991,1990,1989,1988,1987,1986,1985,1984,1983,1982,1981,1980,1979,1978,1977,1976,1975,1974,1973,1972,1971,1970,1969,1968,1967,1966,1965,1964,1963,1962,1961
This statistics in other country:
AlbaniaAlgeriaAngolaArab WorldArgentinaArmeniaAustraliaAustriaAzerbaijanBahrainBangladeshBelarusBelgiumBeninBoliviaBosnia and HerzegovinaBotswanaBrazilBrunei DarussalamBulgariaCambodiaCameroonCanadaCaribbean small statesCentral Europe and the BalticsChileChinaColombiaCongo, Dem. Rep.Congo, Rep.Costa RicaCote d'IvoireCroatiaCubaCuracaoCyprusCzech RepublicDenmarkDominican RepublicEarly-demographic dividendEast Asia & PacificEast Asia & Pacific (excluding high income)East Asia & Pacific (IDA & IBRD countries)EcuadorEgypt, Arab Rep.El SalvadorEritreaEstoniaEthiopiaEuro areaEurope & Central AsiaEurope & Central Asia (excluding high income)Europe & Central Asia (IDA & IBRD countries)European UnionFinlandFragile and conflict affected situationsFranceGabonGeorgiaGermanyGhanaGibraltarGreeceGuatemalaHaitiHeavily indebted poor countries (HIPC)High incomeHondurasHong Kong SAR, ChinaHungaryIBRD onlyIcelandIDA & IBRD totalIDA blendIDA onlyIDA totalIndiaIndonesiaIran, Islamic Rep.IraqIrelandIsraelItalyJamaicaJapanJordanKazakhstanKenyaKorea, Dem. People’s Rep.Korea, Rep.KosovoKuwaitKyrgyz RepublicLate-demographic dividendLatin America & Caribbean Latin America & Caribbean (excluding high income)Latin America & the Caribbean (IDA & IBRD countries)LatviaLeast developed countries: UN classificationLebanonLibyaLithuaniaLow & middle incomeLow incomeLower middle incomeLuxembourgMacedonia, FYRMalaysiaMaltaMauritiusMexicoMiddle East & North AfricaMiddle East & North Africa (excluding high income)Middle East & North Africa (IDA & IBRD countries)Middle incomeMoldovaMongoliaMontenegroMoroccoMozambiqueMyanmarNamibiaNepalNetherlandsNew ZealandNicaraguaNigerNigeriaNorth AmericaNorwayOECD membersOmanOther small statesPakistanPanamaParaguayPeruPhilippinesPolandPortugalPost-demographic dividendPre-demographic dividendQatarRomaniaRussian FederationSaudi ArabiaSenegalSerbiaSingaporeSlovak RepublicSloveniaSmall statesSouth AfricaSouth AsiaSouth Asia (IDA & IBRD)South SudanSpainSri LankaSub-Saharan Africa Sub-Saharan Africa (excluding high income)Sub-Saharan Africa (IDA & IBRD countries)SudanSwedenSwitzerlandSyrian Arab RepublicTajikistanTanzaniaThailandTogoTrinidad and TobagoTunisiaTurkeyTurkmenistanUkraineUnited Arab EmiratesUnited KingdomUnited StatesUpper middle incomeUruguayUzbekistanVenezuela, RBVietnamWorldYemen, Rep.ZambiaZimbabwe Timeline:
This timeline shows a graph from 1961 to 2014 of North America. No data until 1960. Number of actual observations by date: 54.
Source name:
World Development Indicators
Source organization:
IEA Statistics © OECD/IEA 2014 (http://www.iea.org/stats/index.asp), subject to https://www.iea.org/t&c/termsandconditions/
Categories, topics:
Energy & Mining, Trade
Last updated:
apr 23, 2017
Indicators value changes by year
Maximum:
21.455
jan 1, 2006
At the date of observation
Value
Absolute change
Change from previous value
jan 1, 1961
6.709
+6.709
0.0%
jan 1, 1962
6.486
-0.223
-3.32%
jan 1, 1963
6.161
-0.325
-5.01%
jan 1, 1964
6.616
+0.456
7.39%
jan 1, 1965
6.765
+0.148
2.24%
jan 1, 1966
7.55
+0.786
11.62%
jan 1, 1967
7.251
-0.3
-3.97%
jan 1, 1968
4.563
-2.688
-37.07%
jan 1, 1969
5.661
+1.098
24.06%
jan 1, 1970
7.257
+1.596
28.19%
jan 1, 1971
5.595
-1.662
-22.9%
jan 1, 1972
7.899
+2.305
41.19%
jan 1, 1973
9.778
+1.879
23.78%
jan 1, 1974
12.43
+2.652
27.12%
jan 1, 1975
12.567
+0.137
1.1%
jan 1, 1976
12.328
-0.239
-1.9%
jan 1, 1977
17.383
+5.055
41.01%
jan 1, 1978
18.296
+0.913
5.25%
jan 1, 1979
19.516
+1.22
6.67%
jan 1, 1980
15.9
-3.616
-18.53%
jan 1, 1981
11.829
-4.071
-25.6%
jan 1, 1982
9.998
-1.831
-15.48%
jan 1, 1983
6.978
-3.02
-30.21%
jan 1, 1984
10.054
+3.075
44.07%
jan 1, 1985
6.531
-3.523
-35.04%
jan 1, 1986
7.953
+1.421
21.76%
jan 1, 1987
8.642
+0.69
8.67%
jan 1, 1988
10.053
+1.411
16.33%
jan 1, 1989
11.228
+1.175
11.69%
jan 1, 1990
12.666
+1.438
12.81%
jan 1, 1991
9.295
-3.371
-26.61%
jan 1, 1992
9.886
+0.59
6.35%
jan 1, 1993
11.034
+1.148
11.62%
jan 1, 1994
13.98
+2.946
26.7%
jan 1, 1995
12.044
-1.936
-13.85%
jan 1, 1996
12.62
+0.576
4.79%
jan 1, 1997
13.311
+0.691
5.48%
jan 1, 1998
14.027
+0.716
5.38%
jan 1, 1999
14.06
+0.033
0.23%
jan 1, 2000
17.132
+3.072
21.85%
jan 1, 2001
19.203
+2.071
12.09%
jan 1, 2002
16.661
-2.543
-13.24%
jan 1, 2003
18.548
+1.887
11.32%
jan 1, 2004
19.924
+1.377
7.42%
jan 1, 2005
20.657
+0.732
3.68%
jan 1, 2006
21.455
+0.798
3.86%
jan 1, 2007
19.429
-2.026
-9.44%
jan 1, 2008
20.087
+0.657
3.38%
jan 1, 2009
17.093
-2.994
-14.9%
jan 1, 2010
14.058
-3.035
-17.76%
jan 1, 2011
14.101
+0.043
0.31%
jan 1, 2012
10.433
-3.668
-26.01%
jan 1, 2013
7.055
-3.378
-32.38%
jan 1, 2014
5.139
-1.916
-27.16%
Ranking of countries by current statistics by years


Comments: