29
/
en
AIzaSyAYiBZKx7MnpbEhh9jyipgxe19OcubqV5w
April 1, 2024
101015
Canada
CAN
true
2
1
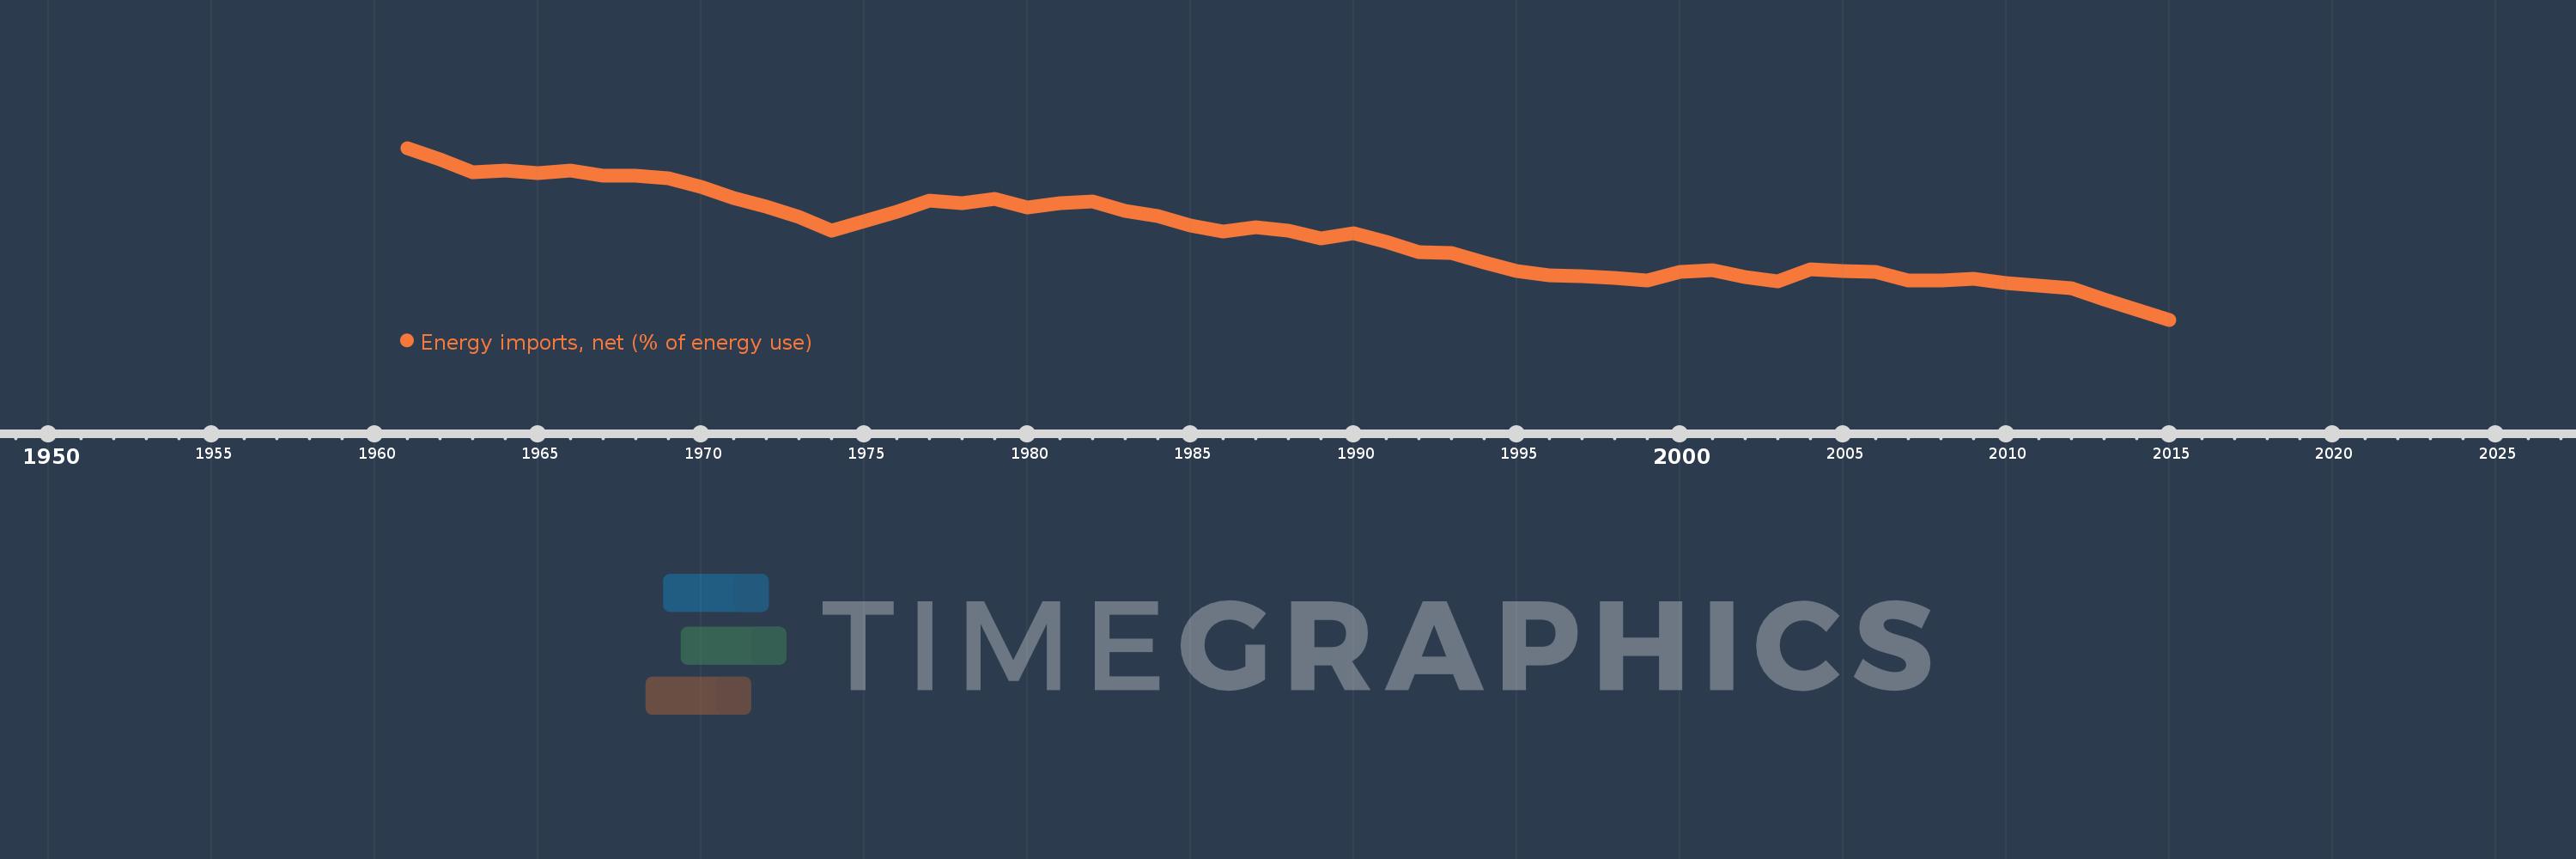
Energy imports, net (% of energy use)
2015,2014,2013,2012,2011,2010,2009,2008,2007,2006,2005,2004,2003,2002,2001,2000,1999,1998,1997,1996,1995,1994,1993,1992,1991,1990,1989,1988,1987,1986,1985,1984,1983,1982,1981,1980,1979,1978,1977,1976,1975,1974,1973,1972,1971,1970,1969,1968,1967,1966,1965,1964,1963,1962,1961
This statistics in other country:
AlbaniaAlgeriaAngolaArab WorldArgentinaArmeniaAustraliaAustriaAzerbaijanBahrainBangladeshBelarusBelgiumBeninBoliviaBosnia and HerzegovinaBotswanaBrazilBrunei DarussalamBulgariaCambodiaCameroonCanadaCaribbean small statesCentral Europe and the BalticsChileChinaColombiaCongo, Dem. Rep.Congo, Rep.Costa RicaCote d'IvoireCroatiaCubaCuracaoCyprusCzech RepublicDenmarkDominican RepublicEarly-demographic dividendEast Asia & PacificEast Asia & Pacific (excluding high income)East Asia & Pacific (IDA & IBRD countries)EcuadorEgypt, Arab Rep.El SalvadorEritreaEstoniaEthiopiaEuro areaEurope & Central AsiaEurope & Central Asia (excluding high income)Europe & Central Asia (IDA & IBRD countries)European UnionFinlandFragile and conflict affected situationsFranceGabonGeorgiaGermanyGhanaGibraltarGreeceGuatemalaHaitiHeavily indebted poor countries (HIPC)High incomeHondurasHong Kong SAR, ChinaHungaryIBRD onlyIcelandIDA & IBRD totalIDA blendIDA onlyIDA totalIndiaIndonesiaIran, Islamic Rep.IraqIrelandIsraelItalyJamaicaJapanJordanKazakhstanKenyaKorea, Dem. People’s Rep.Korea, Rep.KosovoKuwaitKyrgyz RepublicLate-demographic dividendLatin America & Caribbean Latin America & Caribbean (excluding high income)Latin America & the Caribbean (IDA & IBRD countries)LatviaLeast developed countries: UN classificationLebanonLibyaLithuaniaLow & middle incomeLow incomeLower middle incomeLuxembourgMacedonia, FYRMalaysiaMaltaMauritiusMexicoMiddle East & North AfricaMiddle East & North Africa (excluding high income)Middle East & North Africa (IDA & IBRD countries)Middle incomeMoldovaMongoliaMontenegroMoroccoMozambiqueMyanmarNamibiaNepalNetherlandsNew ZealandNicaraguaNigerNigeriaNorth AmericaNorwayOECD membersOmanOther small statesPakistanPanamaParaguayPeruPhilippinesPolandPortugalPost-demographic dividendPre-demographic dividendQatarRomaniaRussian FederationSaudi ArabiaSenegalSerbiaSingaporeSlovak RepublicSloveniaSmall statesSouth AfricaSouth AsiaSouth Asia (IDA & IBRD)South SudanSpainSri LankaSub-Saharan Africa Sub-Saharan Africa (excluding high income)Sub-Saharan Africa (IDA & IBRD countries)SudanSwedenSwitzerlandSyrian Arab RepublicTajikistanTanzaniaThailandTogoTrinidad and TobagoTunisiaTurkeyTurkmenistanUkraineUnited Arab EmiratesUnited KingdomUnited StatesUpper middle incomeUruguayUzbekistanVenezuela, RBVietnamWorldYemen, Rep.ZambiaZimbabwe Timeline:
This timeline shows a graph from 1961 to 2015 of Canada. No data until 1960. Number of actual observations by date: 55.
Source name:
World Development Indicators
Source organization:
IEA Statistics © OECD/IEA 2014 (http://www.iea.org/stats/index.asp), subject to https://www.iea.org/t&c/termsandconditions/
Categories, topics:
Energy & Mining, Trade
Last updated:
apr 23, 2017
Indicators value changes by year
Minimum:
-77.574
jan 1, 2015
Maximum:
25.019
jan 1, 1961
At the date of observation
Value
Absolute change
Change from previous value
jan 1, 1961
25.019
+25.019
0.0%
jan 1, 1962
18.369
-6.651
-26.58%
jan 1, 1963
10.515
-7.854
-42.76%
jan 1, 1964
11.422
+0.907
8.62%
jan 1, 1965
10.006
-1.416
-12.39%
jan 1, 1966
11.536
+1.53
15.29%
jan 1, 1967
8.388
-3.148
-27.29%
jan 1, 1968
8.259
-0.129
-1.53%
jan 1, 1969
7.02
-1.239
-15.0%
jan 1, 1970
2.005
-5.016
-71.44%
jan 1, 1971
-4.822
-6.827
-340.55%
jan 1, 1972
-10.249
-5.427
112.53%
jan 1, 1973
-15.95
-5.701
55.63%
jan 1, 1974
-24.396
-8.447
52.96%
jan 1, 1975
-18.651
+5.745
-23.55%
jan 1, 1976
-13.018
+5.633
-30.2%
jan 1, 1977
-6.487
+6.532
-50.17%
jan 1, 1978
-7.71
-1.223
18.86%
jan 1, 1979
-5.437
+2.273
-29.48%
jan 1, 1980
-10.435
-4.998
91.91%
jan 1, 1981
-7.935
+2.5
-23.96%
jan 1, 1982
-6.875
+1.06
-13.36%
jan 1, 1983
-12.345
-5.47
79.57%
jan 1, 1984
-15.42
-3.075
24.91%
jan 1, 1985
-21.212
-5.792
37.56%
jan 1, 1986
-24.998
-3.786
17.85%
jan 1, 1987
-22.092
+2.906
-11.63%
jan 1, 1988
-24.554
-2.462
11.15%
jan 1, 1989
-29.118
-4.564
18.59%
jan 1, 1990
-26.148
+2.97
-10.2%
jan 1, 1991
-31.238
-5.09
19.46%
jan 1, 1992
-37.021
-5.783
18.51%
jan 1, 1993
-37.939
-0.918
2.48%
jan 1, 1994
-43.38
-5.442
14.34%
jan 1, 1995
-48.386
-5.005
11.54%
jan 1, 1996
-51.169
-2.783
5.75%
jan 1, 1997
-51.784
-0.615
1.2%
jan 1, 1998
-52.837
-1.053
2.03%
jan 1, 1999
-54.134
-1.297
2.45%
jan 1, 2000
-49.15
+4.984
-9.21%
jan 1, 2001
-48.193
+0.958
-1.95%
jan 1, 2002
-52.098
-3.905
8.1%
jan 1, 2003
-54.624
-2.526
4.85%
jan 1, 2004
-47.381
+7.242
-13.26%
jan 1, 2005
-48.659
-1.277
2.7%
jan 1, 2006
-48.925
-0.266
0.55%
jan 1, 2007
-54.039
-5.114
10.45%
jan 1, 2008
-54.191
-0.152
0.28%
jan 1, 2009
-53.086
+1.105
-2.04%
jan 1, 2010
-55.813
-2.727
5.14%
jan 1, 2011
-57.347
-1.534
2.75%
jan 1, 2012
-58.752
-1.405
2.45%
jan 1, 2013
-65.461
-6.709
11.42%
jan 1, 2014
-71.828
-6.367
9.73%
jan 1, 2015
-77.574
-5.745
8.0%
Ranking of countries by current statistics by years


Comments: