29
/
en
AIzaSyAYiBZKx7MnpbEhh9jyipgxe19OcubqV5w
April 1, 2024
33913
European Union
EUU
false
2
1
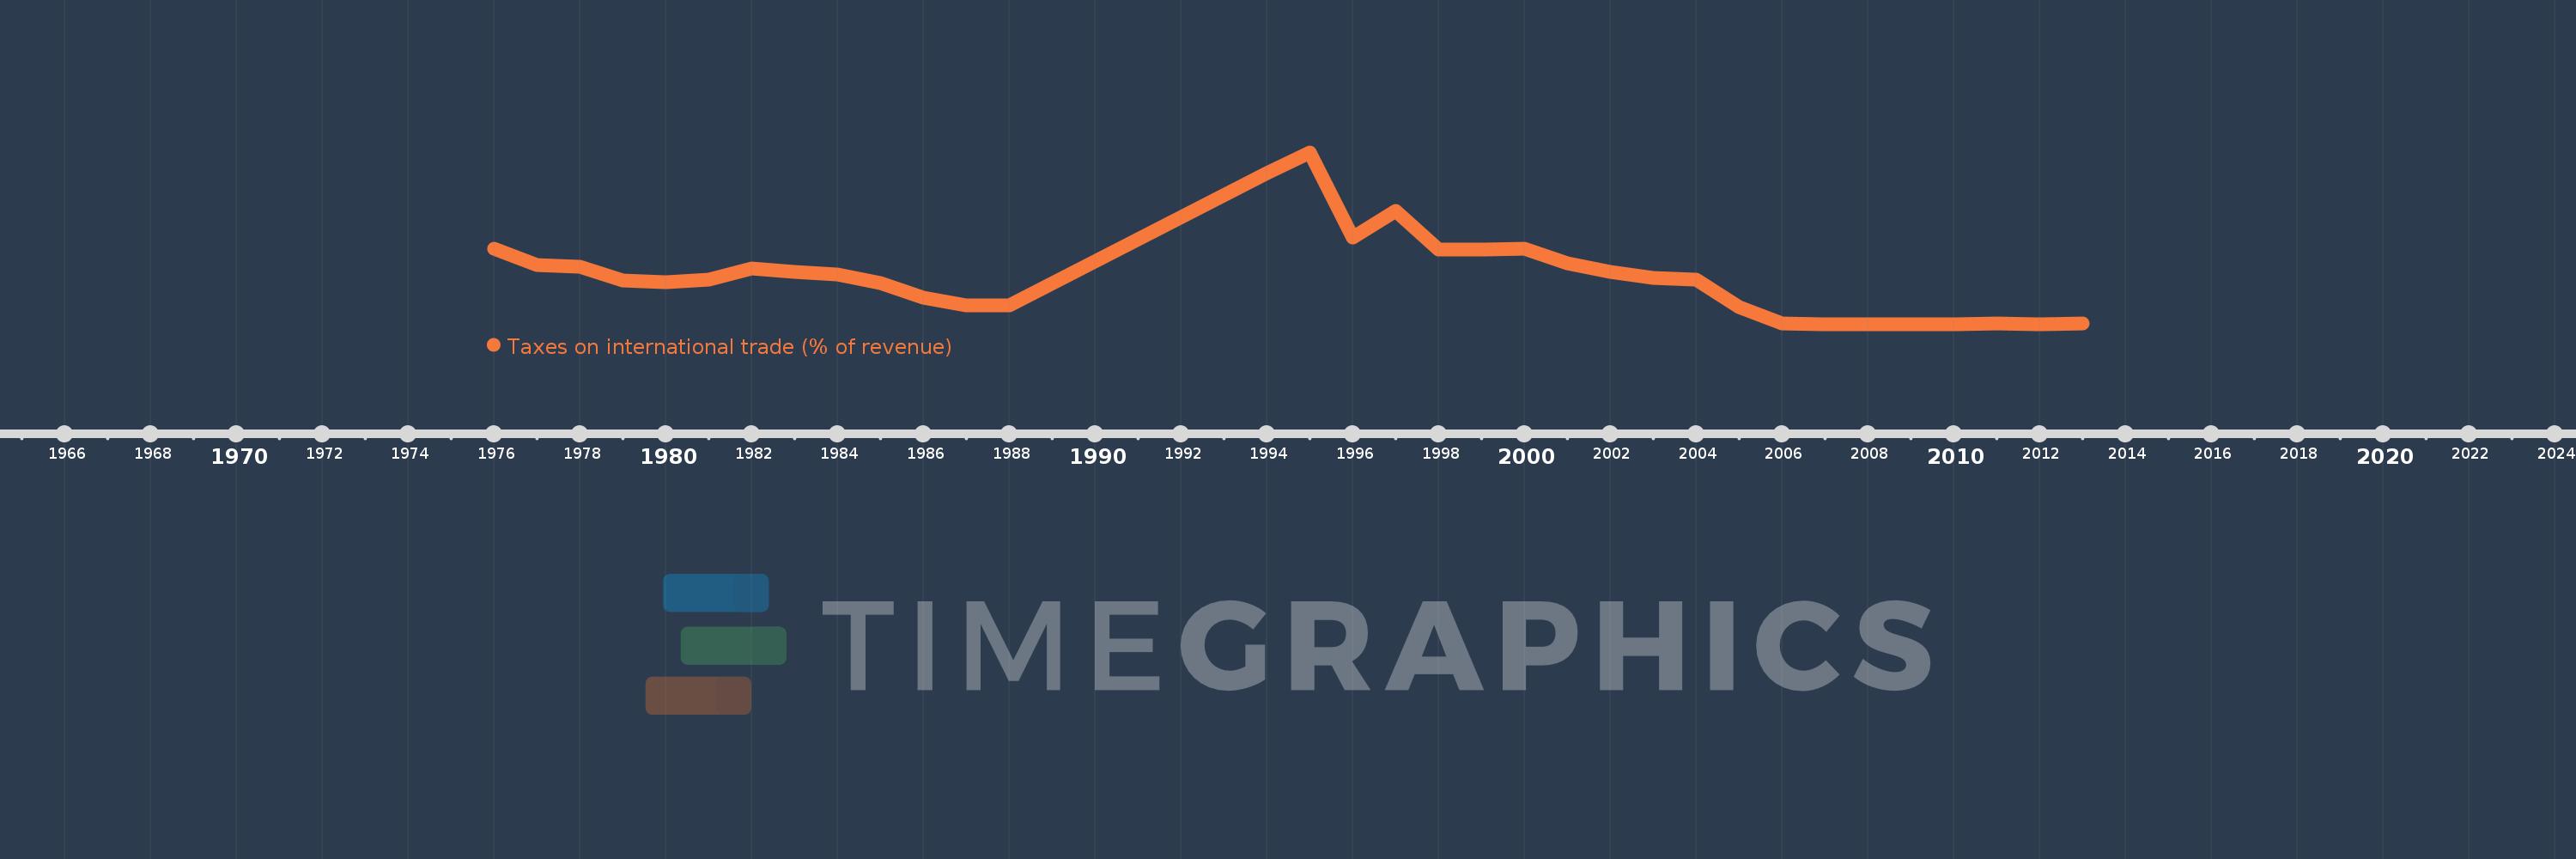
Taxes on international trade (% of revenue)
2013,2012,2011,2010,2009,2008,2007,2006,2005,2004,2003,2002,2001,2000,1999,1998,1997,1996,1995,1994,1988,1987,1986,1985,1984,1983,1982,1981,1980,1979,1978,1977,1976
This statistics in other country:
AfghanistanAlbaniaAlgeriaAngolaAntigua and BarbudaArab WorldArgentinaArmeniaAustraliaAustriaAzerbaijanBahamas, TheBahrainBangladeshBarbadosBelarusBelizeBeninBhutanBoliviaBosnia and HerzegovinaBotswanaBrazilBulgariaBurkina FasoBurundiCabo VerdeCambodiaCanadaCaribbean small statesCentral African RepublicCentral Europe and the BalticsChileChinaColombiaCongo, Dem. Rep.Congo, Rep.Costa RicaCote d'IvoireCroatiaCyprusCzech RepublicDenmarkDominicaDominican RepublicEarly-demographic dividendEast Asia & PacificEast Asia & Pacific (excluding high income)East Asia & Pacific (IDA & IBRD countries)Egypt, Arab Rep.El SalvadorEquatorial GuineaEstoniaEthiopiaEuro areaEurope & Central AsiaEurope & Central Asia (excluding high income)Europe & Central Asia (IDA & IBRD countries)European UnionFijiFinlandFranceGambia, TheGeorgiaGermanyGhanaGreeceGrenadaGuatemalaHeavily indebted poor countries (HIPC)High incomeHondurasHong Kong SAR, ChinaHungaryIBRD onlyIcelandIDA & IBRD totalIDA blendIDA onlyIDA totalIndiaIndonesiaIran, Islamic Rep.IraqIrelandIsraelItalyJamaicaJapanJordanKazakhstanKenyaKiribatiKorea, Rep.KuwaitKyrgyz RepublicLao PDRLate-demographic dividendLatin America & Caribbean Latin America & Caribbean (excluding high income)Latin America & the Caribbean (IDA & IBRD countries)LatviaLeast developed countries: UN classificationLebanonLesothoLiberiaLithuaniaLow & middle incomeLow incomeLower middle incomeLuxembourgMacedonia, FYRMadagascarMalawiMalaysiaMaldivesMaliMaltaMauritiusMexicoMicronesia, Fed. Sts.Middle East & North AfricaMiddle East & North Africa (excluding high income)Middle East & North Africa (IDA & IBRD countries)Middle incomeMoldovaMongoliaMoroccoMozambiqueMyanmarNamibiaNepalNetherlandsNew ZealandNicaraguaNorth AmericaNorwayOECD membersOmanOther small statesPakistanPanamaPapua New GuineaParaguayPeruPhilippinesPolandPortugalPost-demographic dividendPre-demographic dividendQatarRomaniaRussian FederationRwandaSamoaSan MarinoSao Tome and PrincipeSenegalSerbiaSeychellesSierra LeoneSingaporeSlovak RepublicSloveniaSmall statesSolomon IslandsSouth AfricaSouth AsiaSouth Asia (IDA & IBRD)SpainSri LankaSt. Kitts and NevisSt. LuciaSub-Saharan Africa Sub-Saharan Africa (excluding high income)Sub-Saharan Africa (IDA & IBRD countries)SurinameSwazilandSwedenSwitzerlandSyrian Arab RepublicTajikistanTanzaniaThailandTimor-LesteTogoTrinidad and TobagoTunisiaTurkeyUgandaUkraineUnited Arab EmiratesUnited KingdomUnited StatesUpper middle incomeUruguayVanuatuVenezuela, RBVietnamWest Bank and GazaWorldYemen, Rep.ZambiaZimbabwe Timeline:
This timeline shows a graph from 1976 to 2013 of European Union. No data until 1975. Number of actual observations by date: 33.
Source name:
World Development Indicators
Source organization:
International Monetary Fund, Government Finance Statistics Yearbook and data files.
Categories, topics:
Public Sector
Last updated:
apr 23, 2017
Indicators value changes by year
At the date of observation
Value
Absolute change
Change from previous value
jan 1, 1976
1.931
+1.931
0.0%
jan 1, 1977
1.506
-0.426
-22.04%
jan 1, 1978
1.463
-0.042
-2.8%
jan 1, 1979
1.119
-0.345
-23.56%
jan 1, 1980
1.063
-0.056
-5.01%
jan 1, 1981
1.146
+0.083
7.84%
jan 1, 1982
1.42
+0.274
23.9%
jan 1, 1983
1.341
-0.079
-5.57%
jan 1, 1984
1.27
-0.071
-5.26%
jan 1, 1985
1.045
-0.225
-17.75%
jan 1, 1986
0.672
-0.373
-35.67%
jan 1, 1987
0.48
-0.192
-28.64%
jan 1, 1988
0.49
+0.01
2.11%
jan 1, 1994
3.841
+3.351
684.4%
jan 1, 1995
4.363
+0.522
13.58%
jan 1, 1996
2.202
-2.161
-49.53%
jan 1, 1997
2.891
+0.689
31.27%
jan 1, 1998
1.893
-0.997
-34.5%
jan 1, 1999
1.898
+0.005
0.27%
jan 1, 2000
1.927
+0.028
1.5%
jan 1, 2001
1.554
-0.373
-19.36%
jan 1, 2002
1.333
-0.221
-14.23%
jan 1, 2003
1.189
-0.144
-10.78%
jan 1, 2004
1.146
-0.043
-3.6%
jan 1, 2005
0.44
-0.706
-61.59%
jan 1, 2006
0.028
-0.412
-93.59%
jan 1, 2007
0.012
-0.016
-55.77%
jan 1, 2008
0.008
-0.005
-38.85%
jan 1, 2009
0.015
+0.008
98.46%
jan 1, 2010
0.011
-0.005
-30.47%
jan 1, 2011
0.02
+0.01
93.26%
jan 1, 2012
0.013
-0.007
-36.79%
jan 1, 2013
0.017
+0.004
32.62%
Ranking of countries by current statistics by years


Comments: