29
/
en
AIzaSyAYiBZKx7MnpbEhh9jyipgxe19OcubqV5w
April 1, 2024
217220
Pakistan
PAK
true
2
1
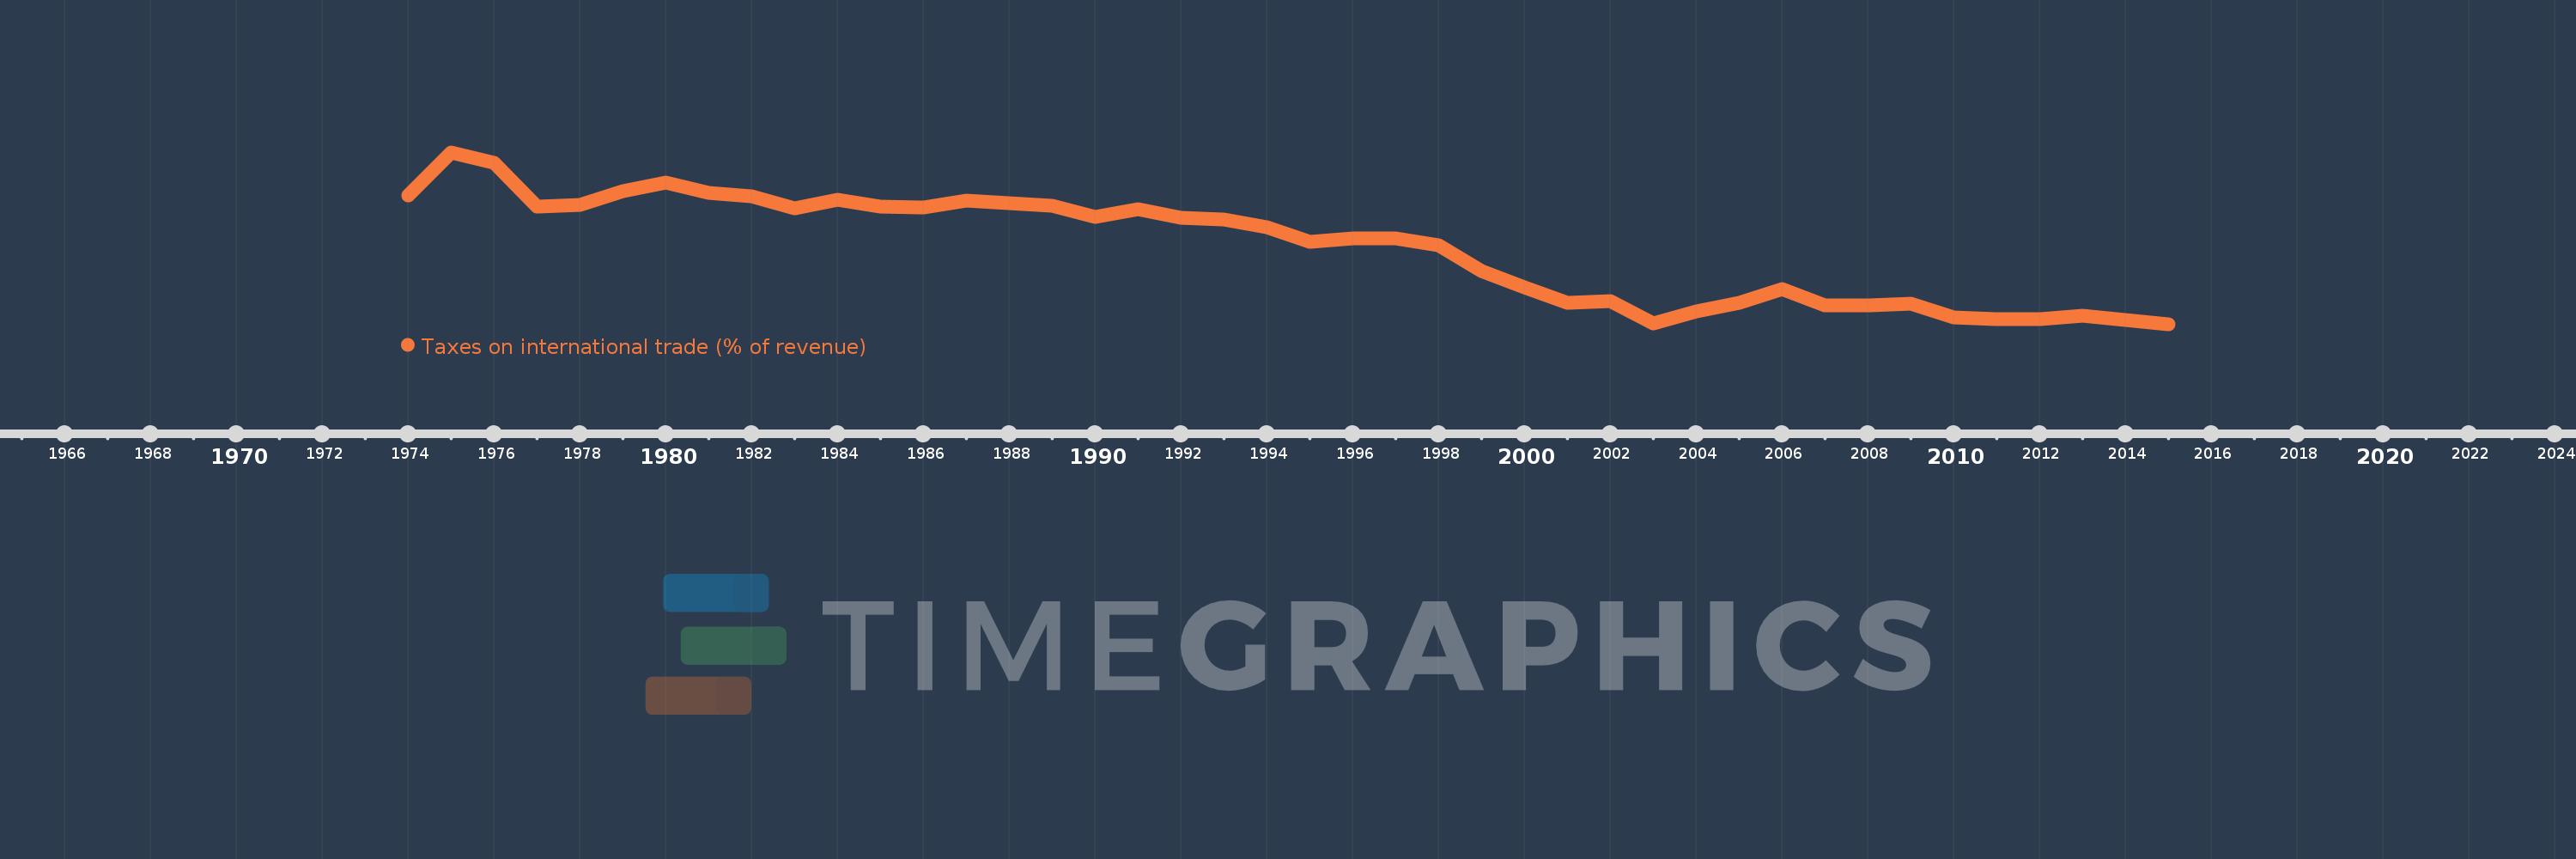
Taxes on international trade (% of revenue)
2015,2014,2013,2012,2011,2010,2009,2008,2007,2006,2005,2004,2003,2002,2001,2000,1999,1998,1997,1996,1995,1994,1993,1992,1991,1990,1989,1987,1986,1985,1984,1983,1982,1981,1980,1979,1978,1977,1976,1975,1974
This statistics in other country:
AfghanistanAlbaniaAlgeriaAngolaAntigua and BarbudaArab WorldArgentinaArmeniaAustraliaAustriaAzerbaijanBahamas, TheBahrainBangladeshBarbadosBelarusBelizeBeninBhutanBoliviaBosnia and HerzegovinaBotswanaBrazilBulgariaBurkina FasoBurundiCabo VerdeCambodiaCanadaCaribbean small statesCentral African RepublicCentral Europe and the BalticsChileChinaColombiaCongo, Dem. Rep.Congo, Rep.Costa RicaCote d'IvoireCroatiaCyprusCzech RepublicDenmarkDominicaDominican RepublicEarly-demographic dividendEast Asia & PacificEast Asia & Pacific (excluding high income)East Asia & Pacific (IDA & IBRD countries)Egypt, Arab Rep.El SalvadorEquatorial GuineaEstoniaEthiopiaEuro areaEurope & Central AsiaEurope & Central Asia (excluding high income)Europe & Central Asia (IDA & IBRD countries)European UnionFijiFinlandFranceGambia, TheGeorgiaGermanyGhanaGreeceGrenadaGuatemalaHeavily indebted poor countries (HIPC)High incomeHondurasHong Kong SAR, ChinaHungaryIBRD onlyIcelandIDA & IBRD totalIDA blendIDA onlyIDA totalIndiaIndonesiaIran, Islamic Rep.IraqIrelandIsraelItalyJamaicaJapanJordanKazakhstanKenyaKiribatiKorea, Rep.KuwaitKyrgyz RepublicLao PDRLate-demographic dividendLatin America & Caribbean Latin America & Caribbean (excluding high income)Latin America & the Caribbean (IDA & IBRD countries)LatviaLeast developed countries: UN classificationLebanonLesothoLiberiaLithuaniaLow & middle incomeLow incomeLower middle incomeLuxembourgMacedonia, FYRMadagascarMalawiMalaysiaMaldivesMaliMaltaMauritiusMexicoMicronesia, Fed. Sts.Middle East & North AfricaMiddle East & North Africa (excluding high income)Middle East & North Africa (IDA & IBRD countries)Middle incomeMoldovaMongoliaMoroccoMozambiqueMyanmarNamibiaNepalNetherlandsNew ZealandNicaraguaNorth AmericaNorwayOECD membersOmanOther small statesPakistanPanamaPapua New GuineaParaguayPeruPhilippinesPolandPortugalPost-demographic dividendPre-demographic dividendQatarRomaniaRussian FederationRwandaSamoaSan MarinoSao Tome and PrincipeSenegalSerbiaSeychellesSierra LeoneSingaporeSlovak RepublicSloveniaSmall statesSolomon IslandsSouth AfricaSouth AsiaSouth Asia (IDA & IBRD)SpainSri LankaSt. Kitts and NevisSt. LuciaSub-Saharan Africa Sub-Saharan Africa (excluding high income)Sub-Saharan Africa (IDA & IBRD countries)SurinameSwazilandSwedenSwitzerlandSyrian Arab RepublicTajikistanTanzaniaThailandTimor-LesteTogoTrinidad and TobagoTunisiaTurkeyUgandaUkraineUnited Arab EmiratesUnited KingdomUnited StatesUpper middle incomeUruguayVanuatuVenezuela, RBVietnamWest Bank and GazaWorldYemen, Rep.ZambiaZimbabwe Timeline:
This timeline shows a graph from 1974 to 2015 of Pakistan. No data until 1973. Number of actual observations by date: 41.
Source name:
World Development Indicators
Source organization:
International Monetary Fund, Government Finance Statistics Yearbook and data files.
Categories, topics:
Public Sector
Last updated:
apr 23, 2017
Indicators value changes by year
Maximum:
40.955
jan 1, 1975
At the date of observation
Value
Absolute change
Change from previous value
jan 1, 1974
32.338
+32.338
0.0%
jan 1, 1975
40.955
+8.617
26.65%
jan 1, 1976
38.847
-2.108
-5.15%
jan 1, 1977
30.111
-8.736
-22.49%
jan 1, 1978
30.454
+0.343
1.14%
jan 1, 1979
33.139
+2.685
8.82%
jan 1, 1980
34.896
+1.757
5.3%
jan 1, 1981
32.839
-2.057
-5.89%
jan 1, 1982
32.152
-0.687
-2.09%
jan 1, 1983
29.858
-2.293
-7.13%
jan 1, 1984
31.532
+1.674
5.61%
jan 1, 1985
30.11
-1.422
-4.51%
jan 1, 1986
29.936
-0.174
-0.58%
jan 1, 1987
31.355
+1.419
4.74%
jan 1, 1989
30.348
-1.007
-3.21%
jan 1, 1990
28.017
-2.331
-7.68%
jan 1, 1991
29.631
+1.614
5.76%
jan 1, 1992
27.887
-1.744
-5.89%
jan 1, 1993
27.587
-0.301
-1.08%
jan 1, 1994
26.039
-1.548
-5.61%
jan 1, 1995
23.033
-3.006
-11.54%
jan 1, 1996
23.759
+0.726
3.15%
jan 1, 1997
23.689
-0.07
-0.29%
jan 1, 1998
22.405
-1.284
-5.42%
jan 1, 1999
17.179
-5.226
-23.32%
jan 1, 2000
14.06
-3.119
-18.16%
jan 1, 2001
10.831
-3.229
-22.97%
jan 1, 2002
11.179
+0.348
3.21%
jan 1, 2003
6.733
-4.446
-39.77%
jan 1, 2004
9.17
+2.437
36.19%
jan 1, 2005
10.887
+1.717
18.73%
jan 1, 2006
13.579
+2.692
24.73%
jan 1, 2007
10.322
-3.256
-23.98%
jan 1, 2008
10.322
0.0
0.0%
jan 1, 2009
10.689
+0.367
3.55%
jan 1, 2010
8.041
-2.648
-24.77%
jan 1, 2011
7.565
-0.476
-5.92%
jan 1, 2012
7.631
+0.066
0.87%
jan 1, 2013
8.326
+0.695
9.1%
jan 1, 2014
7.397
-0.929
-11.15%
jan 1, 2015
6.628
-0.769
-10.39%
Ranking of countries by current statistics by years


Comments: