29
/
en
AIzaSyAYiBZKx7MnpbEhh9jyipgxe19OcubqV5w
April 1, 2024
270126
Turkey
TUR
true
2
1
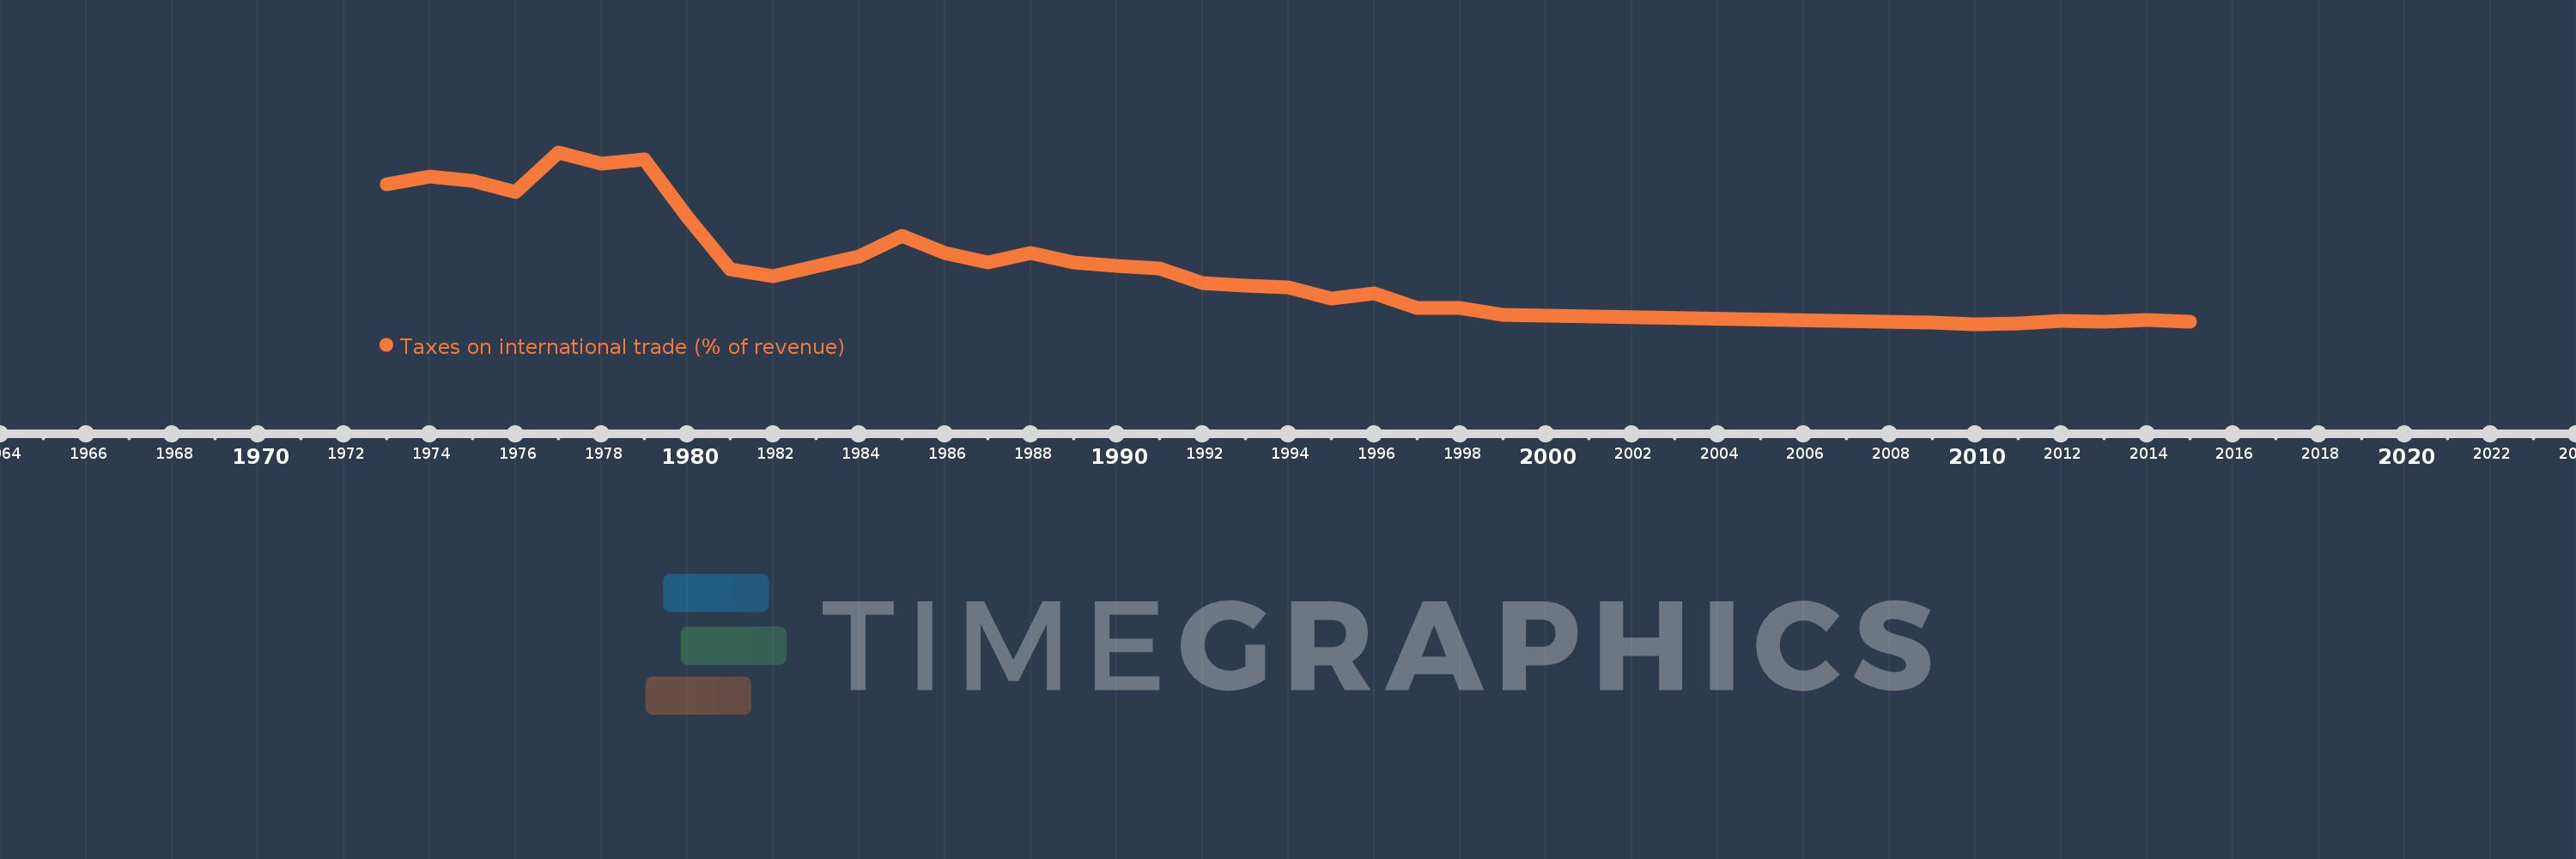
Taxes on international trade (% of revenue)
2015,2014,2013,2012,2011,2010,2009,1999,1998,1997,1996,1995,1994,1993,1992,1991,1990,1989,1988,1987,1986,1985,1984,1982,1981,1980,1979,1978,1977,1976,1975,1974,1973
This statistics in other country:
AfghanistanAlbaniaAlgeriaAngolaAntigua and BarbudaArab WorldArgentinaArmeniaAustraliaAustriaAzerbaijanBahamas, TheBahrainBangladeshBarbadosBelarusBelizeBeninBhutanBoliviaBosnia and HerzegovinaBotswanaBrazilBulgariaBurkina FasoBurundiCabo VerdeCambodiaCanadaCaribbean small statesCentral African RepublicCentral Europe and the BalticsChileChinaColombiaCongo, Dem. Rep.Congo, Rep.Costa RicaCote d'IvoireCroatiaCyprusCzech RepublicDenmarkDominicaDominican RepublicEarly-demographic dividendEast Asia & PacificEast Asia & Pacific (excluding high income)East Asia & Pacific (IDA & IBRD countries)Egypt, Arab Rep.El SalvadorEquatorial GuineaEstoniaEthiopiaEuro areaEurope & Central AsiaEurope & Central Asia (excluding high income)Europe & Central Asia (IDA & IBRD countries)European UnionFijiFinlandFranceGambia, TheGeorgiaGermanyGhanaGreeceGrenadaGuatemalaHeavily indebted poor countries (HIPC)High incomeHondurasHong Kong SAR, ChinaHungaryIBRD onlyIcelandIDA & IBRD totalIDA blendIDA onlyIDA totalIndiaIndonesiaIran, Islamic Rep.IraqIrelandIsraelItalyJamaicaJapanJordanKazakhstanKenyaKiribatiKorea, Rep.KuwaitKyrgyz RepublicLao PDRLate-demographic dividendLatin America & Caribbean Latin America & Caribbean (excluding high income)Latin America & the Caribbean (IDA & IBRD countries)LatviaLeast developed countries: UN classificationLebanonLesothoLiberiaLithuaniaLow & middle incomeLow incomeLower middle incomeLuxembourgMacedonia, FYRMadagascarMalawiMalaysiaMaldivesMaliMaltaMauritiusMexicoMicronesia, Fed. Sts.Middle East & North AfricaMiddle East & North Africa (excluding high income)Middle East & North Africa (IDA & IBRD countries)Middle incomeMoldovaMongoliaMoroccoMozambiqueMyanmarNamibiaNepalNetherlandsNew ZealandNicaraguaNorth AmericaNorwayOECD membersOmanOther small statesPakistanPanamaPapua New GuineaParaguayPeruPhilippinesPolandPortugalPost-demographic dividendPre-demographic dividendQatarRomaniaRussian FederationRwandaSamoaSan MarinoSao Tome and PrincipeSenegalSerbiaSeychellesSierra LeoneSingaporeSlovak RepublicSloveniaSmall statesSolomon IslandsSouth AfricaSouth AsiaSouth Asia (IDA & IBRD)SpainSri LankaSt. Kitts and NevisSt. LuciaSub-Saharan Africa Sub-Saharan Africa (excluding high income)Sub-Saharan Africa (IDA & IBRD countries)SurinameSwazilandSwedenSwitzerlandSyrian Arab RepublicTajikistanTanzaniaThailandTimor-LesteTogoTrinidad and TobagoTunisiaTurkeyUgandaUkraineUnited Arab EmiratesUnited KingdomUnited StatesUpper middle incomeUruguayVanuatuVenezuela, RBVietnamWest Bank and GazaWorldYemen, Rep.ZambiaZimbabwe Timeline:
This timeline shows a graph from 1973 to 2015 of Turkey. No data until 1972. Number of actual observations by date: 33.
Source name:
World Development Indicators
Source organization:
International Monetary Fund, Government Finance Statistics Yearbook and data files.
Categories, topics:
Public Sector
Last updated:
apr 23, 2017
Indicators value changes by year
At the date of observation
Value
Absolute change
Change from previous value
jan 1, 1973
13.924
+13.924
0.0%
jan 1, 1974
14.671
+0.747
5.37%
jan 1, 1975
14.246
-0.425
-2.9%
jan 1, 1976
13.235
-1.011
-7.09%
jan 1, 1977
16.91
+3.675
27.77%
jan 1, 1978
15.891
-1.019
-6.03%
jan 1, 1979
16.266
+0.375
2.36%
jan 1, 1980
10.852
-5.415
-33.29%
jan 1, 1981
5.956
-4.896
-45.12%
jan 1, 1982
5.341
-0.615
-10.32%
jan 1, 1984
7.192
+1.851
34.66%
jan 1, 1985
9.101
+1.908
26.53%
jan 1, 1986
7.518
-1.583
-17.39%
jan 1, 1987
6.63
-0.888
-11.81%
jan 1, 1988
7.45
+0.819
12.36%
jan 1, 1989
6.603
-0.847
-11.37%
jan 1, 1990
6.286
-0.317
-4.79%
jan 1, 1991
6.031
-0.255
-4.06%
jan 1, 1992
4.641
-1.39
-23.04%
jan 1, 1993
4.407
-0.234
-5.04%
jan 1, 1994
4.285
-0.123
-2.78%
jan 1, 1995
3.194
-1.091
-25.46%
jan 1, 1996
3.699
+0.505
15.81%
jan 1, 1997
2.335
-1.364
-36.88%
jan 1, 1998
2.328
-0.006
-0.27%
jan 1, 1999
1.704
-0.624
-26.81%
jan 1, 2009
0.97
-0.734
-43.09%
jan 1, 2010
0.817
-0.152
-15.72%
jan 1, 2011
0.911
+0.094
11.53%
jan 1, 2012
1.117
+0.206
22.59%
jan 1, 2013
1.088
-0.029
-2.58%
jan 1, 2014
1.205
+0.116
10.67%
jan 1, 2015
1.087
-0.118
-9.77%
Ranking of countries by current statistics by years


Comments: