29
/
en
AIzaSyAYiBZKx7MnpbEhh9jyipgxe19OcubqV5w
April 1, 2024
278325
Uruguay
URY
true
2
1
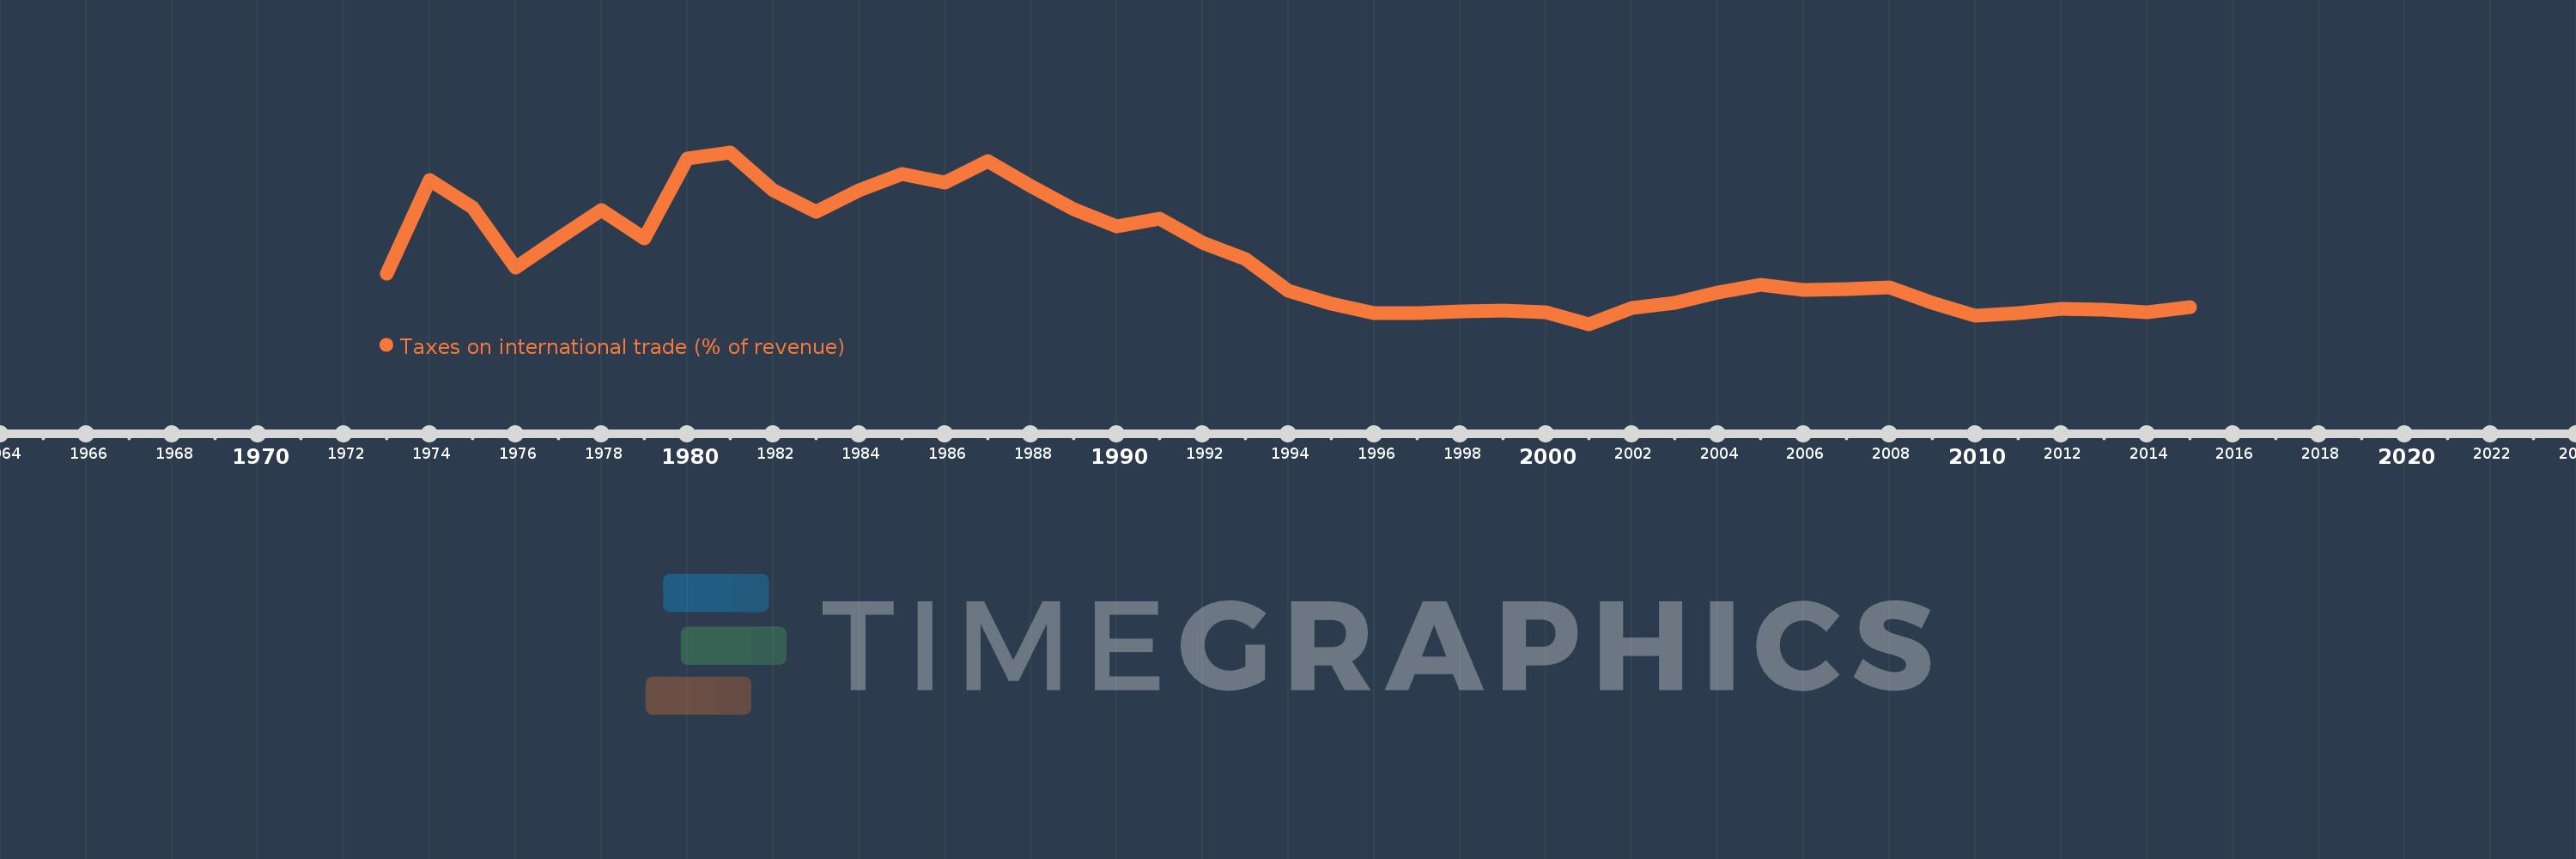
Taxes on international trade (% of revenue)
2015,2014,2013,2012,2011,2010,2009,2008,2007,2006,2005,2004,2003,2002,2001,2000,1999,1998,1997,1996,1995,1994,1993,1992,1991,1990,1989,1988,1987,1986,1985,1984,1983,1982,1981,1980,1979,1978,1977,1976,1975,1974,1973
This statistics in other country:
AfghanistanAlbaniaAlgeriaAngolaAntigua and BarbudaArab WorldArgentinaArmeniaAustraliaAustriaAzerbaijanBahamas, TheBahrainBangladeshBarbadosBelarusBelizeBeninBhutanBoliviaBosnia and HerzegovinaBotswanaBrazilBulgariaBurkina FasoBurundiCabo VerdeCambodiaCanadaCaribbean small statesCentral African RepublicCentral Europe and the BalticsChileChinaColombiaCongo, Dem. Rep.Congo, Rep.Costa RicaCote d'IvoireCroatiaCyprusCzech RepublicDenmarkDominicaDominican RepublicEarly-demographic dividendEast Asia & PacificEast Asia & Pacific (excluding high income)East Asia & Pacific (IDA & IBRD countries)Egypt, Arab Rep.El SalvadorEquatorial GuineaEstoniaEthiopiaEuro areaEurope & Central AsiaEurope & Central Asia (excluding high income)Europe & Central Asia (IDA & IBRD countries)European UnionFijiFinlandFranceGambia, TheGeorgiaGermanyGhanaGreeceGrenadaGuatemalaHeavily indebted poor countries (HIPC)High incomeHondurasHong Kong SAR, ChinaHungaryIBRD onlyIcelandIDA & IBRD totalIDA blendIDA onlyIDA totalIndiaIndonesiaIran, Islamic Rep.IraqIrelandIsraelItalyJamaicaJapanJordanKazakhstanKenyaKiribatiKorea, Rep.KuwaitKyrgyz RepublicLao PDRLate-demographic dividendLatin America & Caribbean Latin America & Caribbean (excluding high income)Latin America & the Caribbean (IDA & IBRD countries)LatviaLeast developed countries: UN classificationLebanonLesothoLiberiaLithuaniaLow & middle incomeLow incomeLower middle incomeLuxembourgMacedonia, FYRMadagascarMalawiMalaysiaMaldivesMaliMaltaMauritiusMexicoMicronesia, Fed. Sts.Middle East & North AfricaMiddle East & North Africa (excluding high income)Middle East & North Africa (IDA & IBRD countries)Middle incomeMoldovaMongoliaMoroccoMozambiqueMyanmarNamibiaNepalNetherlandsNew ZealandNicaraguaNorth AmericaNorwayOECD membersOmanOther small statesPakistanPanamaPapua New GuineaParaguayPeruPhilippinesPolandPortugalPost-demographic dividendPre-demographic dividendQatarRomaniaRussian FederationRwandaSamoaSan MarinoSao Tome and PrincipeSenegalSerbiaSeychellesSierra LeoneSingaporeSlovak RepublicSloveniaSmall statesSolomon IslandsSouth AfricaSouth AsiaSouth Asia (IDA & IBRD)SpainSri LankaSt. Kitts and NevisSt. LuciaSub-Saharan Africa Sub-Saharan Africa (excluding high income)Sub-Saharan Africa (IDA & IBRD countries)SurinameSwazilandSwedenSwitzerlandSyrian Arab RepublicTajikistanTanzaniaThailandTimor-LesteTogoTrinidad and TobagoTunisiaTurkeyUgandaUkraineUnited Arab EmiratesUnited KingdomUnited StatesUpper middle incomeUruguayVanuatuVenezuela, RBVietnamWest Bank and GazaWorldYemen, Rep.ZambiaZimbabwe Timeline:
This timeline shows a graph from 1973 to 2015 of Uruguay. No data until 1972. Number of actual observations by date: 43.
Source name:
World Development Indicators
Source organization:
International Monetary Fund, Government Finance Statistics Yearbook and data files.
Categories, topics:
Public Sector
Last updated:
apr 23, 2017
Indicators value changes by year
Maximum:
14.224
jan 1, 1981
At the date of observation
Value
Absolute change
Change from previous value
jan 1, 1973
6.137
+6.137
0.0%
jan 1, 1974
12.364
+6.226
101.45%
jan 1, 1975
10.561
-1.803
-14.58%
jan 1, 1976
6.543
-4.018
-38.04%
jan 1, 1977
8.489
+1.945
29.73%
jan 1, 1978
10.399
+1.911
22.51%
jan 1, 1979
8.504
-1.896
-18.23%
jan 1, 1980
13.791
+5.288
62.18%
jan 1, 1981
14.224
+0.433
3.14%
jan 1, 1982
11.709
-2.515
-17.68%
jan 1, 1983
10.244
-1.465
-12.51%
jan 1, 1984
11.703
+1.459
14.25%
jan 1, 1985
12.794
+1.091
9.32%
jan 1, 1986
12.22
-0.575
-4.49%
jan 1, 1987
13.658
+1.438
11.77%
jan 1, 1988
11.997
-1.661
-12.16%
jan 1, 1989
10.431
-1.566
-13.05%
jan 1, 1990
9.288
-1.143
-10.96%
jan 1, 1991
9.796
+0.507
5.46%
jan 1, 1992
8.212
-1.584
-16.17%
jan 1, 1993
7.137
-1.074
-13.08%
jan 1, 1994
5.008
-2.13
-29.84%
jan 1, 1995
4.131
-0.877
-17.51%
jan 1, 1996
3.539
-0.592
-14.32%
jan 1, 1997
3.495
-0.044
-1.24%
jan 1, 1998
3.614
+0.119
3.4%
jan 1, 1999
3.699
+0.086
2.37%
jan 1, 2000
3.587
-0.113
-3.05%
jan 1, 2001
2.779
-0.808
-22.52%
jan 1, 2002
3.874
+1.095
39.42%
jan 1, 2003
4.198
+0.324
8.35%
jan 1, 2004
4.908
+0.711
16.93%
jan 1, 2005
5.391
+0.482
9.82%
jan 1, 2006
5.078
-0.313
-5.8%
jan 1, 2007
5.12
+0.041
0.82%
jan 1, 2008
5.217
+0.097
1.89%
jan 1, 2009
4.212
-1.005
-19.26%
jan 1, 2010
3.372
-0.84
-19.94%
jan 1, 2011
3.508
+0.135
4.01%
jan 1, 2012
3.791
+0.283
8.08%
jan 1, 2013
3.739
-0.052
-1.36%
jan 1, 2014
3.553
-0.186
-4.97%
jan 1, 2015
3.941
+0.387
10.9%
Ranking of countries by current statistics by years


Comments: