29
/
en
AIzaSyAYiBZKx7MnpbEhh9jyipgxe19OcubqV5w
April 1, 2024
105518
Chile
CHL
true
2
1
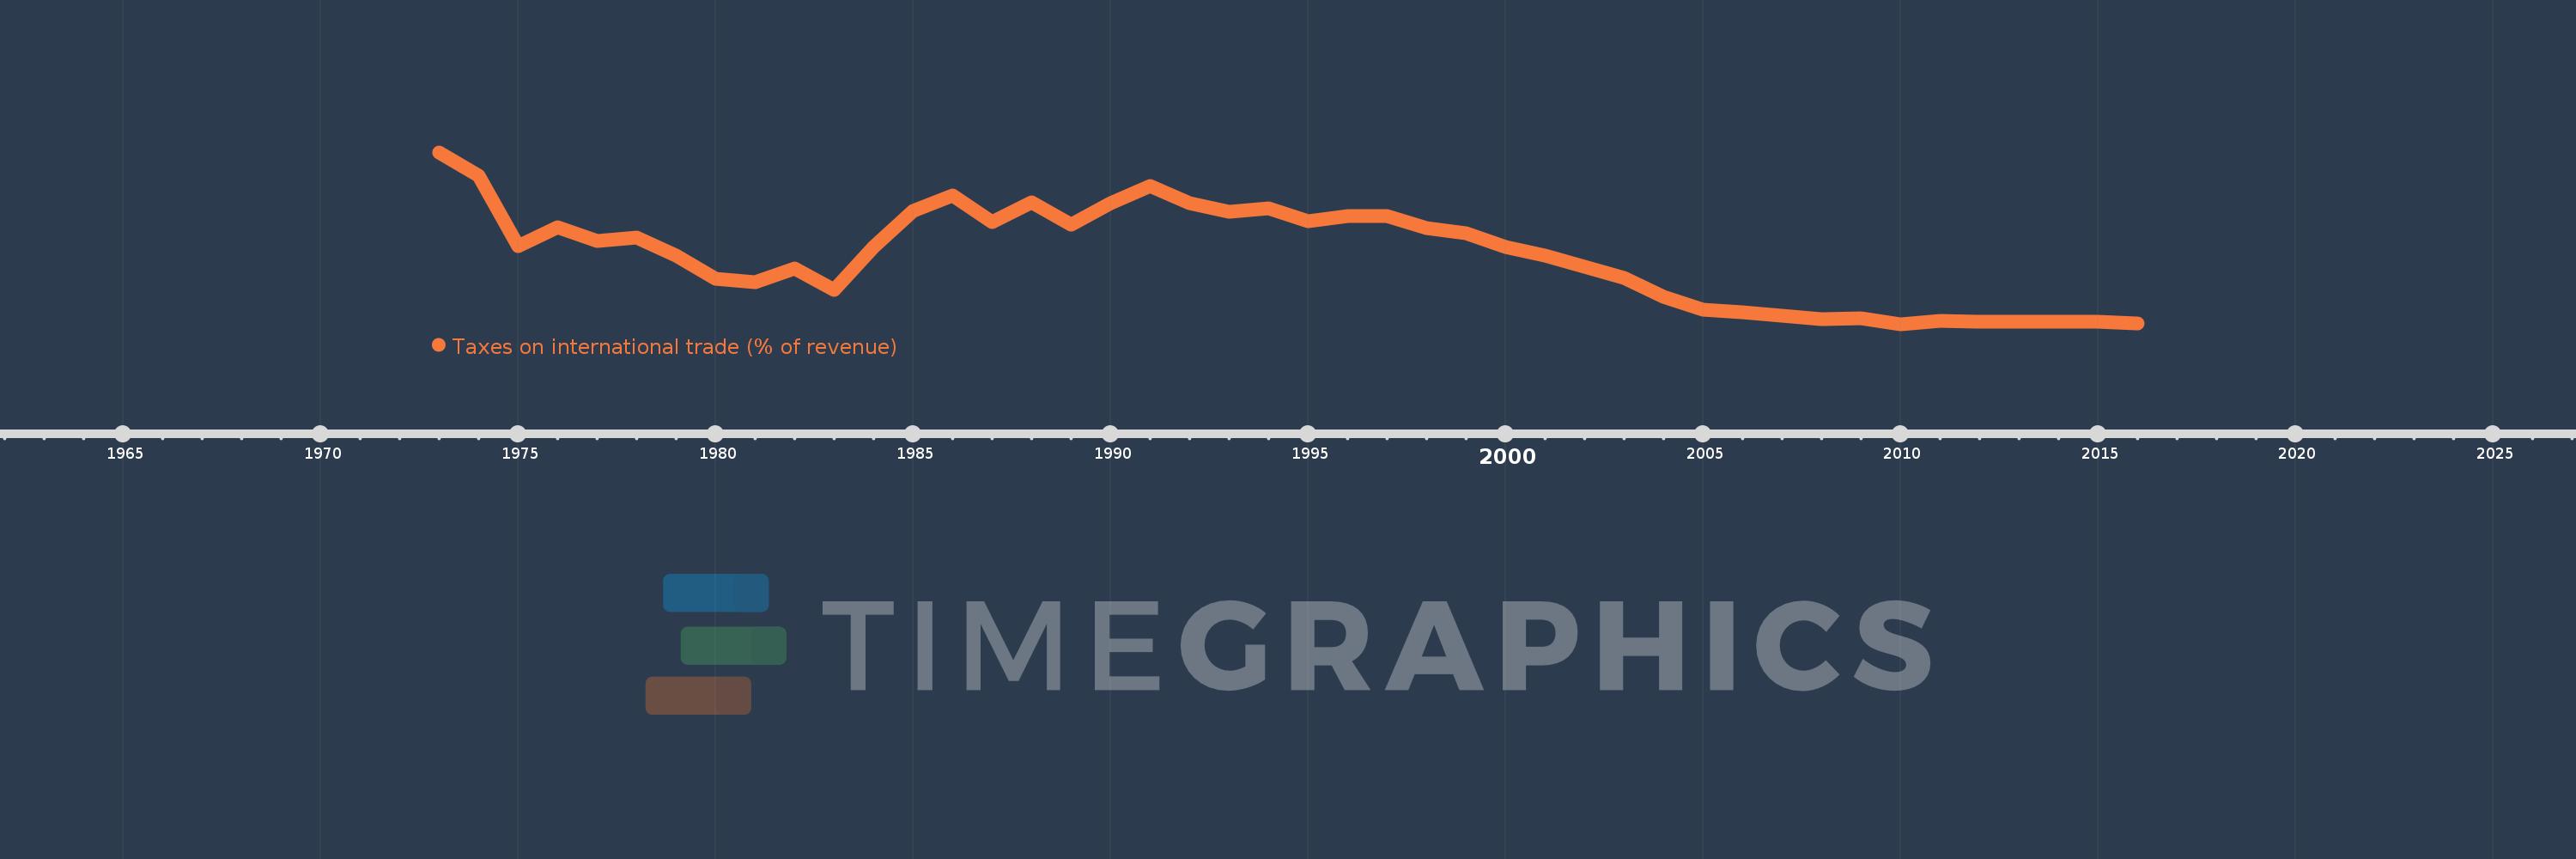
Taxes on international trade (% of revenue)
2016,2015,2014,2013,2012,2011,2010,2009,2008,2007,2006,2005,2004,2003,2002,2001,2000,1999,1998,1997,1996,1995,1994,1993,1992,1991,1990,1989,1988,1987,1986,1985,1984,1983,1982,1981,1980,1979,1978,1977,1976,1975,1974,1973
This statistics in other country:
AfghanistanAlbaniaAlgeriaAngolaAntigua and BarbudaArab WorldArgentinaArmeniaAustraliaAustriaAzerbaijanBahamas, TheBahrainBangladeshBarbadosBelarusBelizeBeninBhutanBoliviaBosnia and HerzegovinaBotswanaBrazilBulgariaBurkina FasoBurundiCabo VerdeCambodiaCanadaCaribbean small statesCentral African RepublicCentral Europe and the BalticsChileChinaColombiaCongo, Dem. Rep.Congo, Rep.Costa RicaCote d'IvoireCroatiaCyprusCzech RepublicDenmarkDominicaDominican RepublicEarly-demographic dividendEast Asia & PacificEast Asia & Pacific (excluding high income)East Asia & Pacific (IDA & IBRD countries)Egypt, Arab Rep.El SalvadorEquatorial GuineaEstoniaEthiopiaEuro areaEurope & Central AsiaEurope & Central Asia (excluding high income)Europe & Central Asia (IDA & IBRD countries)European UnionFijiFinlandFranceGambia, TheGeorgiaGermanyGhanaGreeceGrenadaGuatemalaHeavily indebted poor countries (HIPC)High incomeHondurasHong Kong SAR, ChinaHungaryIBRD onlyIcelandIDA & IBRD totalIDA blendIDA onlyIDA totalIndiaIndonesiaIran, Islamic Rep.IraqIrelandIsraelItalyJamaicaJapanJordanKazakhstanKenyaKiribatiKorea, Rep.KuwaitKyrgyz RepublicLao PDRLate-demographic dividendLatin America & Caribbean Latin America & Caribbean (excluding high income)Latin America & the Caribbean (IDA & IBRD countries)LatviaLeast developed countries: UN classificationLebanonLesothoLiberiaLithuaniaLow & middle incomeLow incomeLower middle incomeLuxembourgMacedonia, FYRMadagascarMalawiMalaysiaMaldivesMaliMaltaMauritiusMexicoMicronesia, Fed. Sts.Middle East & North AfricaMiddle East & North Africa (excluding high income)Middle East & North Africa (IDA & IBRD countries)Middle incomeMoldovaMongoliaMoroccoMozambiqueMyanmarNamibiaNepalNetherlandsNew ZealandNicaraguaNorth AmericaNorwayOECD membersOmanOther small statesPakistanPanamaPapua New GuineaParaguayPeruPhilippinesPolandPortugalPost-demographic dividendPre-demographic dividendQatarRomaniaRussian FederationRwandaSamoaSan MarinoSao Tome and PrincipeSenegalSerbiaSeychellesSierra LeoneSingaporeSlovak RepublicSloveniaSmall statesSolomon IslandsSouth AfricaSouth AsiaSouth Asia (IDA & IBRD)SpainSri LankaSt. Kitts and NevisSt. LuciaSub-Saharan Africa Sub-Saharan Africa (excluding high income)Sub-Saharan Africa (IDA & IBRD countries)SurinameSwazilandSwedenSwitzerlandSyrian Arab RepublicTajikistanTanzaniaThailandTimor-LesteTogoTrinidad and TobagoTunisiaTurkeyUgandaUkraineUnited Arab EmiratesUnited KingdomUnited StatesUpper middle incomeUruguayVanuatuVenezuela, RBVietnamWest Bank and GazaWorldYemen, Rep.ZambiaZimbabwe Timeline:
This timeline shows a graph from 1973 to 2016 of Chile. No data until 1972. Number of actual observations by date: 44.
Source name:
World Development Indicators
Source organization:
International Monetary Fund, Government Finance Statistics Yearbook and data files.
Categories, topics:
Public Sector
Last updated:
apr 23, 2017
Indicators value changes by year
Maximum:
14.286
jan 1, 1973
At the date of observation
Value
Absolute change
Change from previous value
jan 1, 1973
14.286
+14.286
0.0%
jan 1, 1974
12.5
-1.786
-12.5%
jan 1, 1975
7.004
-5.496
-43.97%
jan 1, 1976
8.428
+1.424
20.33%
jan 1, 1977
7.364
-1.063
-12.62%
jan 1, 1978
7.618
+0.254
3.44%
jan 1, 1979
6.251
-1.367
-17.94%
jan 1, 1980
4.457
-1.795
-28.71%
jan 1, 1981
4.159
-0.298
-6.68%
jan 1, 1982
5.259
+1.1
26.45%
jan 1, 1983
3.562
-1.697
-32.26%
jan 1, 1984
6.911
+3.348
94.0%
jan 1, 1985
9.752
+2.841
41.11%
jan 1, 1986
10.897
+1.145
11.74%
jan 1, 1987
8.848
-2.049
-18.8%
jan 1, 1988
10.4
+1.552
17.54%
jan 1, 1989
8.664
-1.736
-16.7%
jan 1, 1990
10.309
+1.646
19.0%
jan 1, 1991
11.691
+1.382
13.4%
jan 1, 1992
10.321
-1.37
-11.72%
jan 1, 1993
9.643
-0.679
-6.57%
jan 1, 1994
9.939
+0.296
3.07%
jan 1, 1995
8.936
-1.003
-10.09%
jan 1, 1996
9.343
+0.407
4.56%
jan 1, 1997
9.319
-0.024
-0.25%
jan 1, 1998
8.395
-0.924
-9.92%
jan 1, 1999
7.951
-0.444
-5.29%
jan 1, 2000
6.927
-1.024
-12.88%
jan 1, 2001
6.249
-0.678
-9.78%
jan 1, 2002
5.39
-0.859
-13.74%
jan 1, 2003
4.467
-0.923
-17.13%
jan 1, 2004
2.998
-1.469
-32.88%
jan 1, 2005
2.026
-0.972
-32.43%
jan 1, 2006
1.816
-0.21
-10.34%
jan 1, 2007
1.565
-0.251
-13.82%
jan 1, 2008
1.277
-0.289
-18.44%
jan 1, 2009
1.354
+0.078
6.11%
jan 1, 2010
0.887
-0.468
-34.53%
jan 1, 2011
1.127
+0.24
27.07%
jan 1, 2012
1.064
-0.063
-5.61%
jan 1, 2013
1.089
+0.026
2.42%
jan 1, 2014
1.05
-0.039
-3.61%
jan 1, 2015
1.103
+0.053
5.02%
jan 1, 2016
0.964
-0.139
-12.56%
Ranking of countries by current statistics by years


Comments: